This guide walks you through each section of the Investment Property Analyzer report, so you know what every number tells your client and how to talk them through it. Use it alongside the Investment Property Analyzer step-by-step guide, which covers creating, editing, and sharing the report.
Navigating to the Investment Property Analyzer
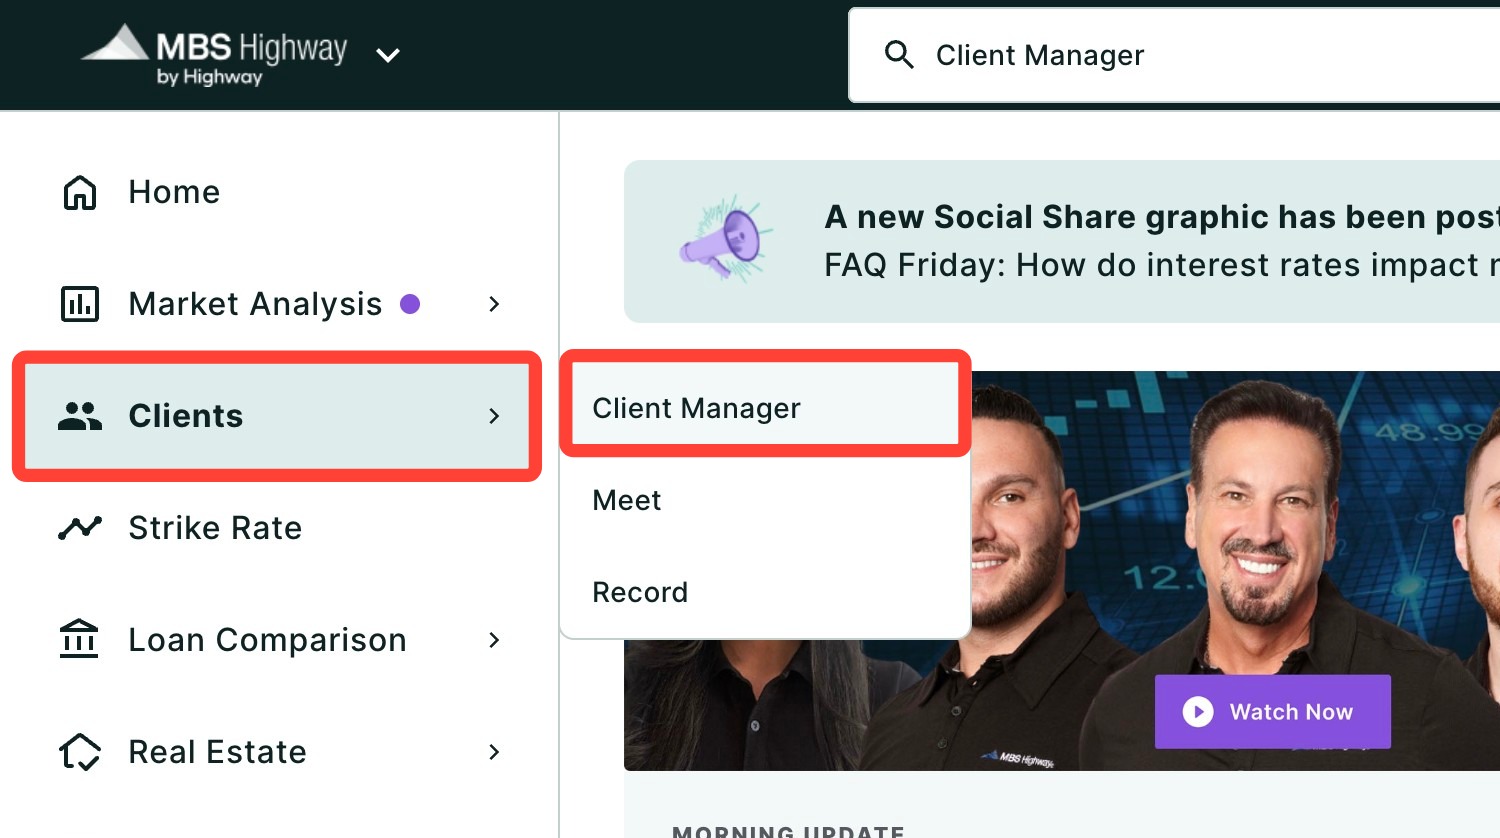
You can find your Investment Property Analyzer within Client Manager as well as within the Real Estate sidebar menu.
Navigating through the Client Manager
Client Manager allows you to create reports for your clients using previously saved loan and property details, saving you time when building new scenarios. To learn more, click here.
Navigating through the left-hand sidebar menu
To access the Investment Property Analyzer report using the left-hand sidebar menu, click Real Estate, then click Investment Property Analyzer.
💡 Helpful Tip: You can also search and favorite reports, tools, and calculators. Click here to learn how. |
Report Overview
The top of the report sets the scene for your client and lets you adjust how long they plan to own the property.
Greeting and Your Details
The report opens with a personalized greeting addressed to your client, along with your headshot, name, NMLS#, and company. To edit your branding information, go to your account settings under your headshot drop-down menu in the right hand corner of the page.
Hold Period Slider
Below the location, a slider asks How long do you plan on owning this property? and displays the current value in years. Drag the slider to change the length of ownership. Every figure that depends on time updates to match, including the return cards, cash flow cards, table, and both charts. Period labels update too, so the Cumulative Cash Flow card reads Through Year 9 when you set the slider to 9 years.
💡 Helpful Tip: The slider stays visible as you scroll through the report, so you or your client can change the ownership length at any point and see how the returns shift. |
Return on Investment
Directly beneath the slider, a headline card states your client's original investment (down payment and initial renovation cost) and the returns the property is estimated to have produced over the ownership period:
- Return on Investment: The total profit as a percentage of the original investment.
- Avg. Annual Compounded Return: The same return expressed as an average yearly rate.
Positive returns display in green and negative returns display in red.
Estimated Cash Flow
This section shows how much the property brings in compared to what it costs to carry.
Cash Flow Cards
- Monthly Cash Flow: The monthly cash flow in Year 1, with Rental Income and Expenses listed beneath it.
- Cumulative Cash Flow: The total cash flow from Year 1 through the end of the ownership period based on the slider (e.g., Through Year 9), with Rental Income and Expenses listed beneath it. The Rental Income line notes the annual rent increase used in the analysis. The annual rent increase is editable.
- Cumulative Cash-on-Cash Return: Measures the annual cash flow over time as a percentage of the initial investment (down payment and initial renovation cost).
Positive cash flow displays in green and negative cash flow displays in red.
Cash Flow Chart
A banner above the chart states, in plain language, when the property turns cash flow positive (e.g., Cashflow is positive in Year 1). The chart shows Rental Income and Expenses as stacked bars for each year, with a Cashflow line running across them. Hover over any year to see that year's Rental Income, Expenses, and Cashflow.
Click on the icons in the legend to hide or show their corresponding data in the chart below.
Annual Cash Flow Table
The table gives you the year-by-year numbers, with one column for each year of ownership and these rows:
- Rental Income
- Total Expenses
- Total Cash Flow
- Cash-on-Cash Return
Expand the Total Expenses row to see what makes up your client's expenses each year:
- Principal & Interest
- Property Tax/Insurance
- Maintenance & Repairs
- HOA Fees
- Management Fee
Please note: Monthly mortgage insurance does not appear as its own row. It is included in the Prop. Tax/Insurance row. |
Total Return on Investment
This section shows where your client's total return comes from and how it builds over time.
Appreciation Gain and Amortization Gain
- Appreciation Gain: The total gain from the home increasing in value. It lists your chosen yearly appreciation rate (this is editable), the Starting Home Value, and the estimated home value after the final year of ownership (e.g., Est. Value After Yr 9).
- Amortization Gain: The total principal paid over the ownership period. It lists the Rate and APR, the Original Loan Amount, and the Remaining Principal.
Annual Total Return on Investment Chart
The total profit appears in the top left of the chart (e.g., $126,800). The chart shows one bar for each year, and each bar is labeled with the cumulative profit through that year and the matching percentage of your client's original investment. Years with a loss display as short red bars with negative labels, which makes it easy to show your client when the investment crosses from loss to profit.
Profit Summary
Beneath the chart, a summary adds everything up:
- Rental Income: Total rent collected, with the annual rent increase noted.
- Appreciation: The appreciation gained over the designated period of time.
- Gross Revenue: Rental income plus appreciation.
- - Expenses: Total expenses, itemized beneath as Interest, Property Tax, Insurance, Repairs, Closing Costs, and Fees.
- Profit: Gross revenue minus expenses.
Closing Message and Disclaimers
The report ends with a short note offering to review the options and answer your client's questions, followed by your signature block with your name, NMLS#, company, phone number, and email address. Licensing and product disclaimers, along with compliance logos, appear at the bottom of the report. Click here to learn how to edit this information.
Go back to the Investment Property Analyzer step-by-step guide to learn how to create, edit, and share your report.
Need Help?
Have questions or want to learn more? Submit a ticket or call us today!
Related to