This guide breaks down each section of the Investment Property Analysis report, including monthly and cumulative cash flow, cash on cash return, estimated annual cash flow, appreciation and amortization gains, and total return on investment.
Navigating to the Investment Property Analyzer
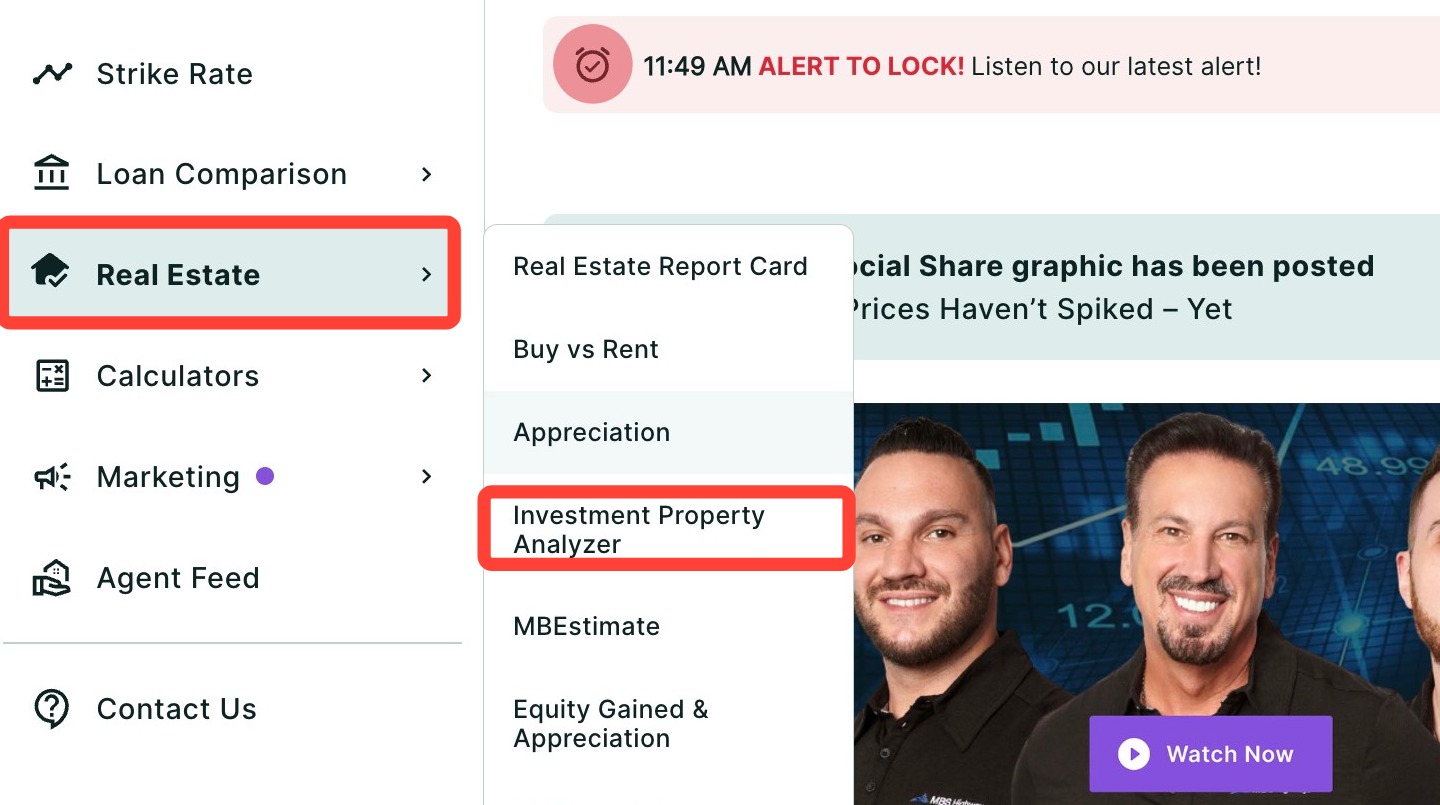
You can find the Investment Property Analyzer within the Real Estate tab in the left-hand navigation menu.
What's Inside the Investment Property Analysis
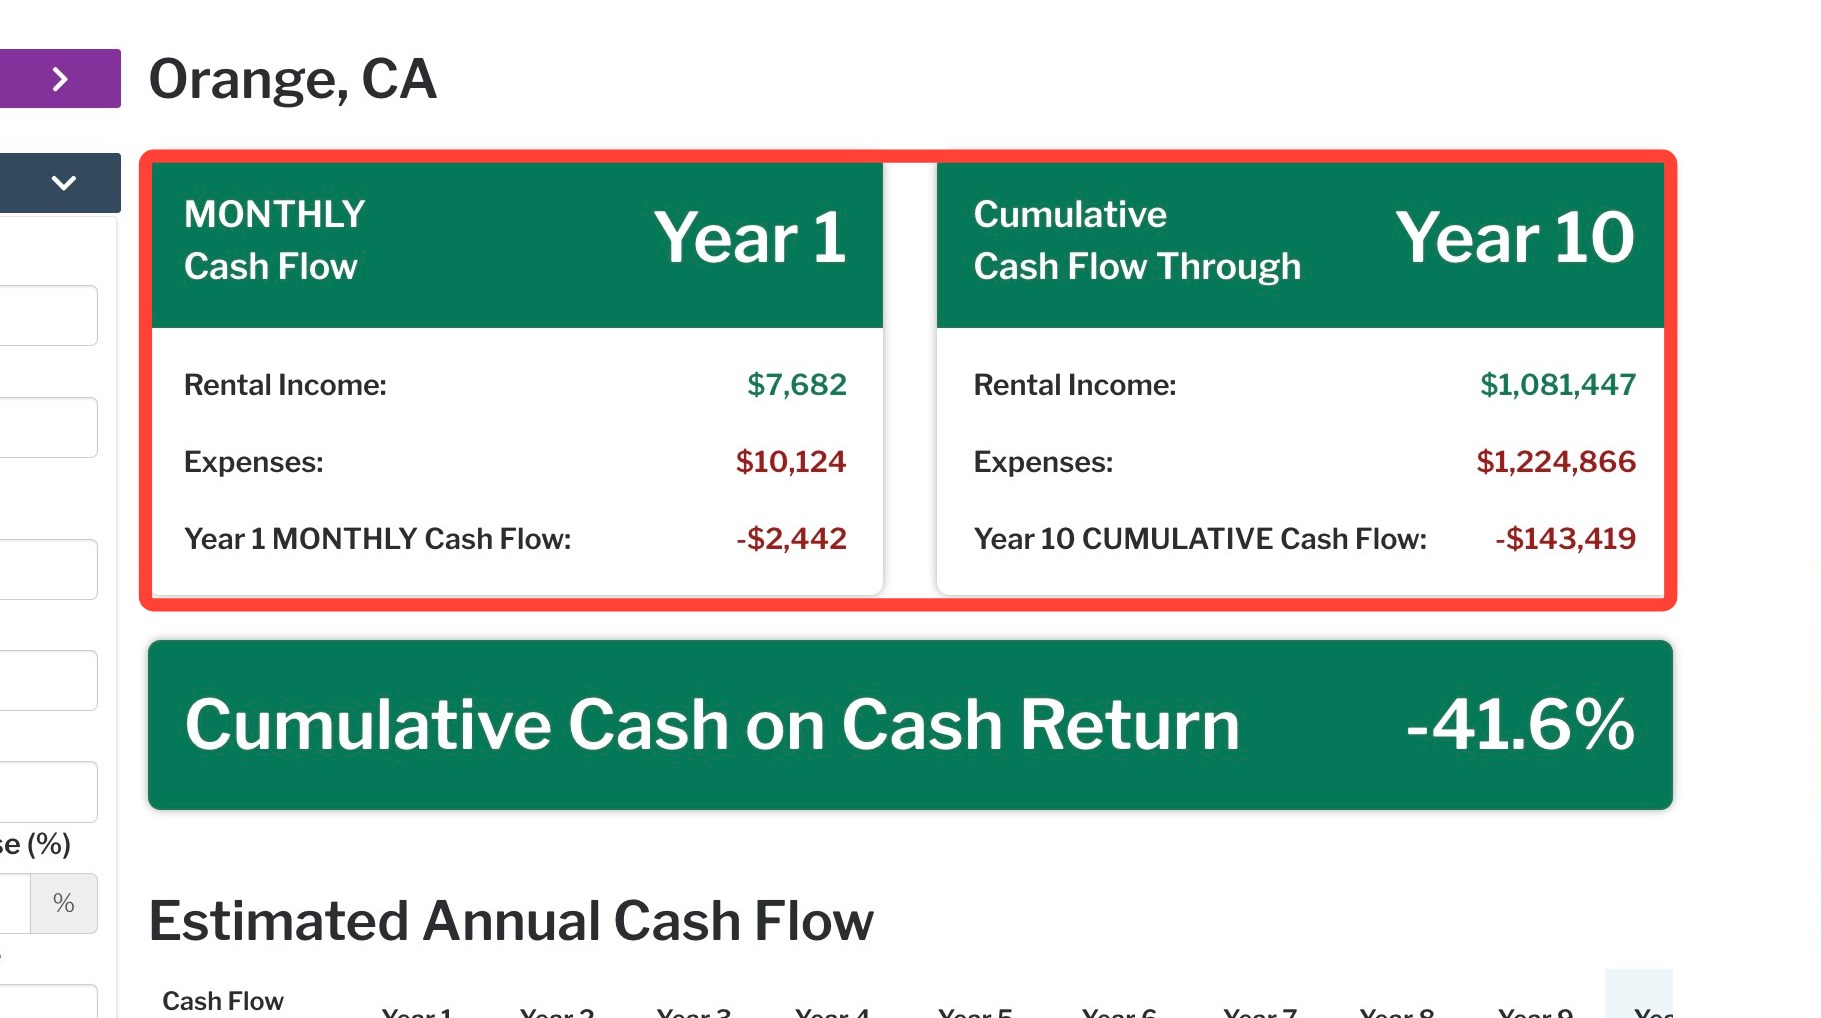
- At the top of the report is the total monthly cash flow in year 1 and the cumulative cash flow through 10 years of home ownership.
- The duration of home ownership can be edited in the Yrs Before Selling field, found in the Home Ownership tab (Maximum of 10 years).
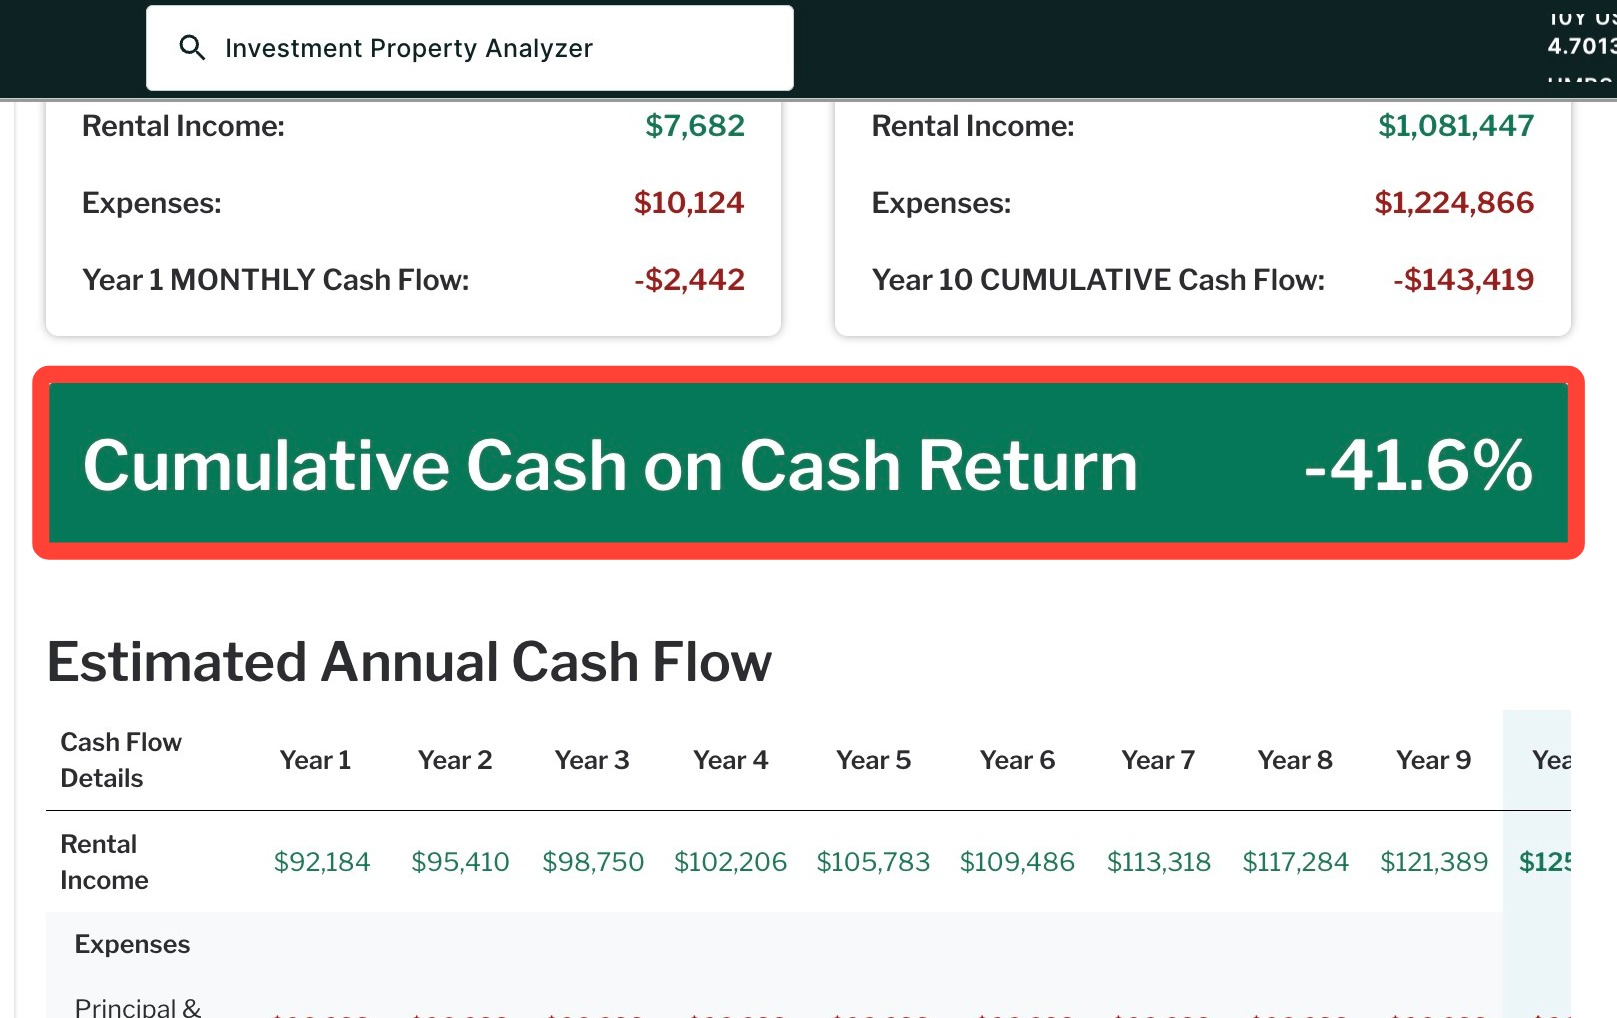
- The Cumulative Cash on Cash Return measures the annual cash flow over time as a percentage of the initial outlays (down payment, closing costs, renovation costs).
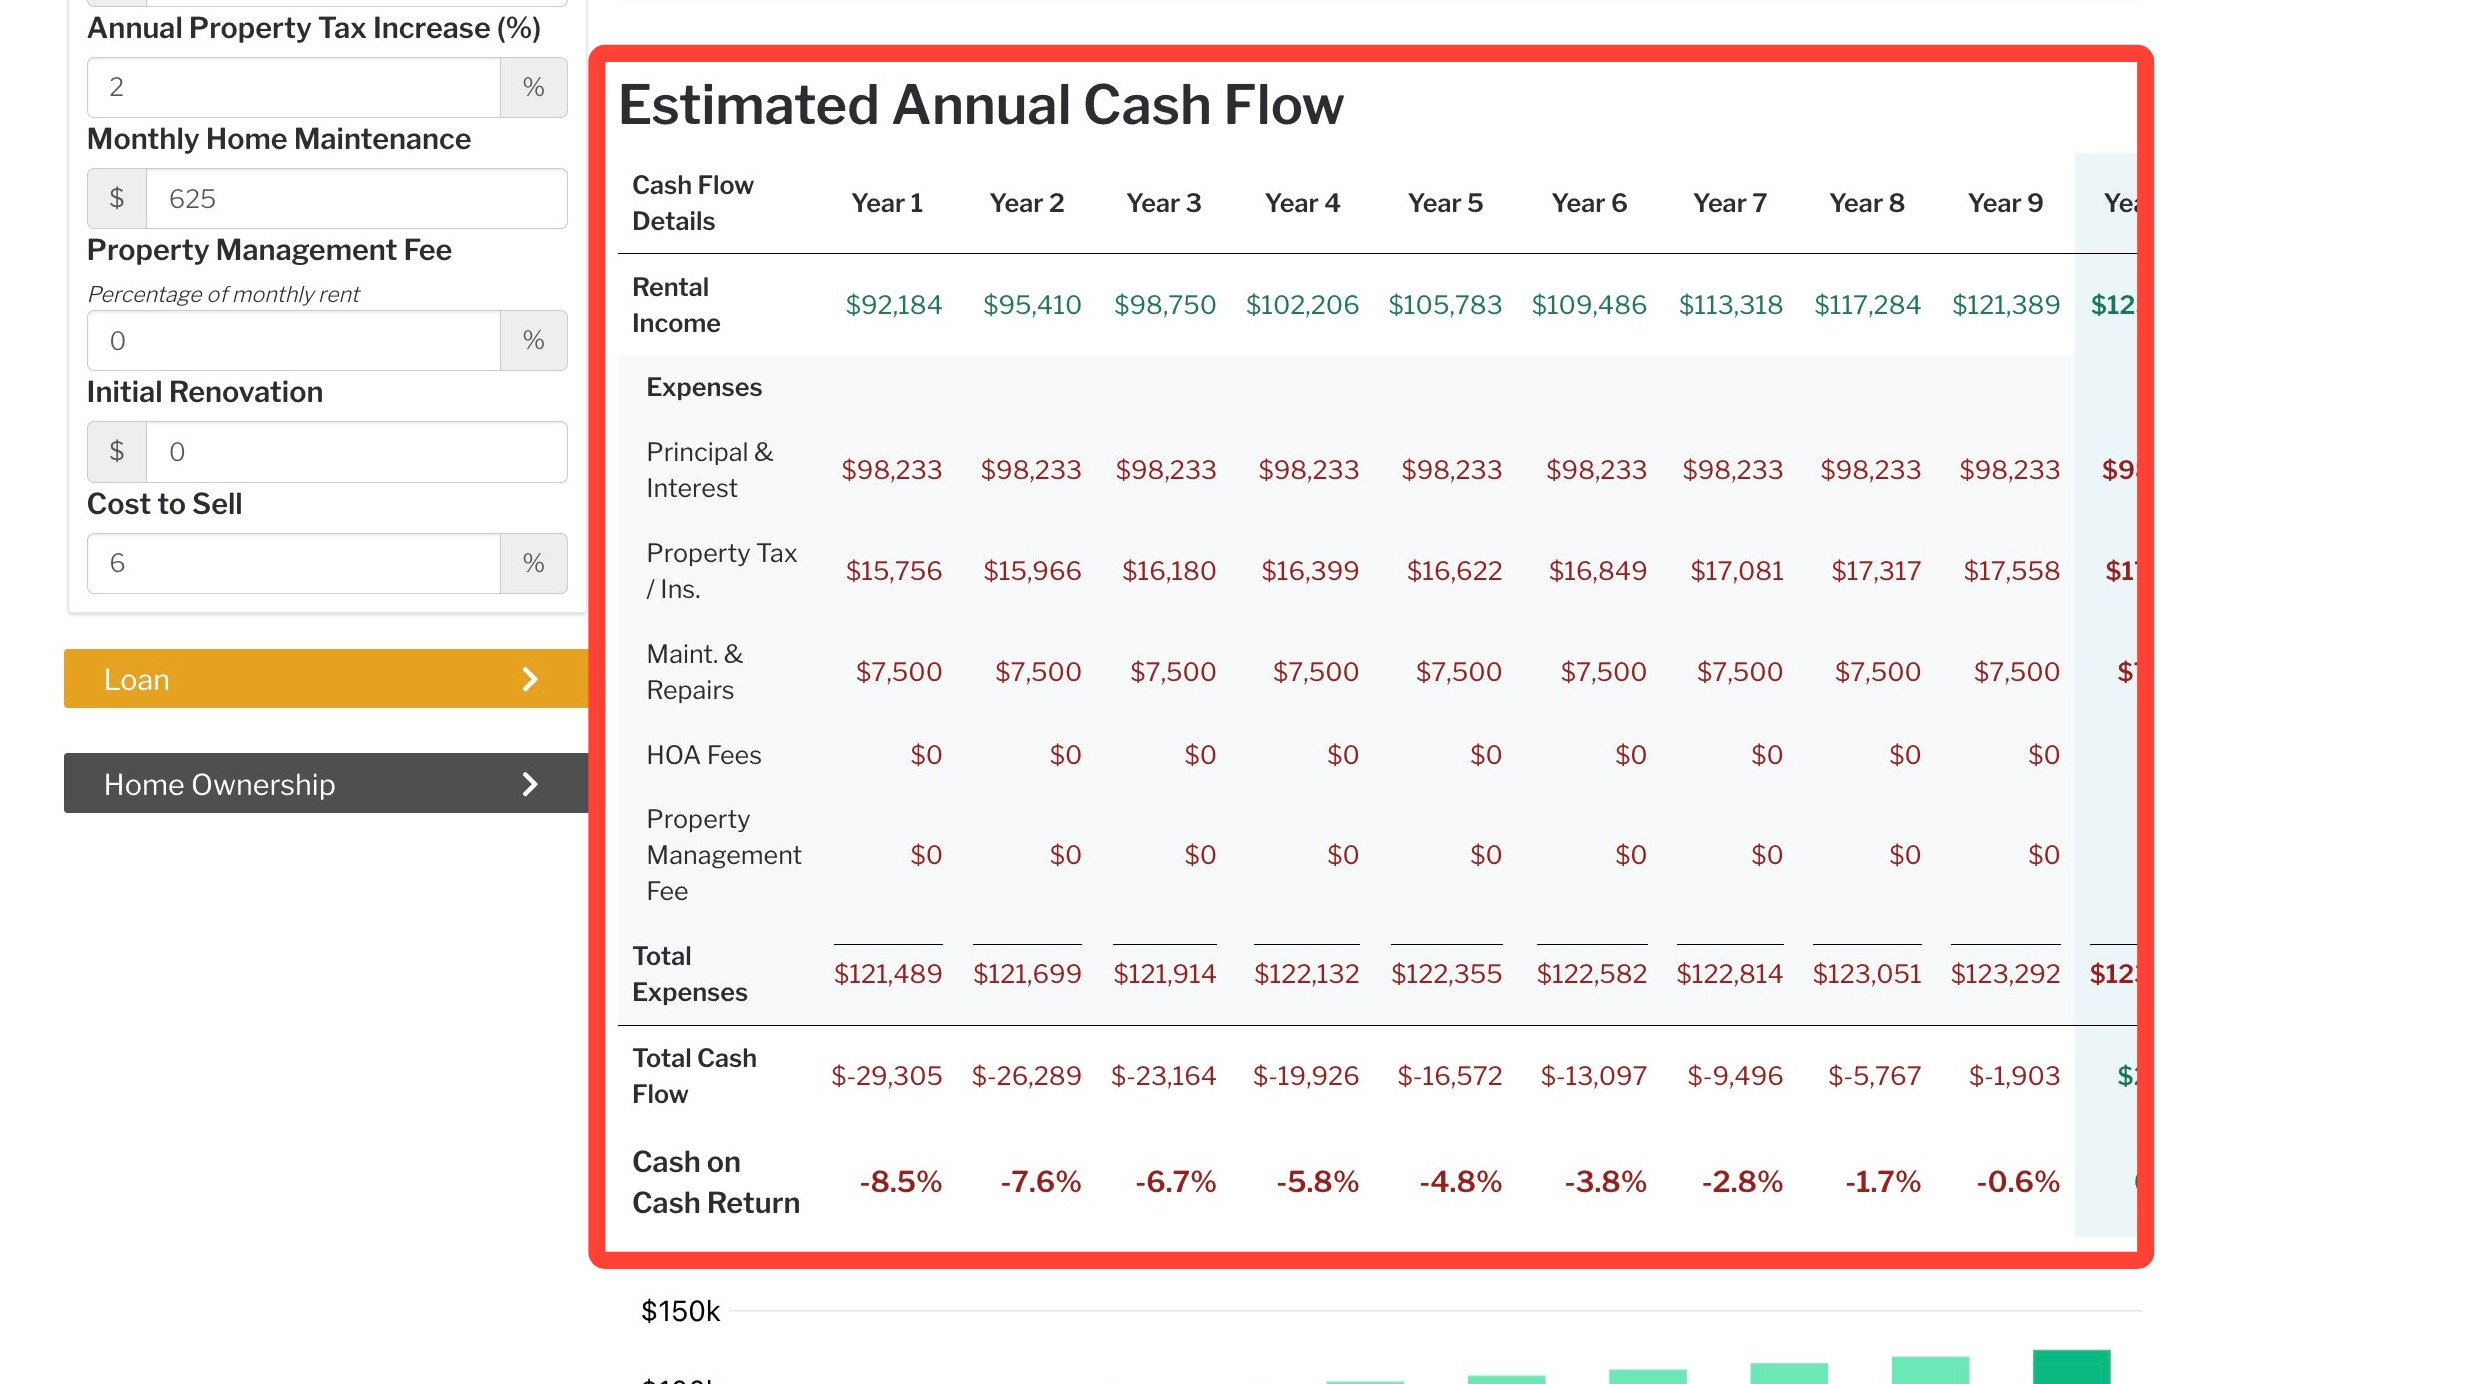
- Estimated Annual Cash Flow lists the expected rental income, expenses, total cash flow and cash on cash return for each year. The expenses are broken down in principal and interest, property taxes and insurance, maintenance and repairs, HOA and property management fees.
- The graph visualizes the estimated annual cash flow over time.
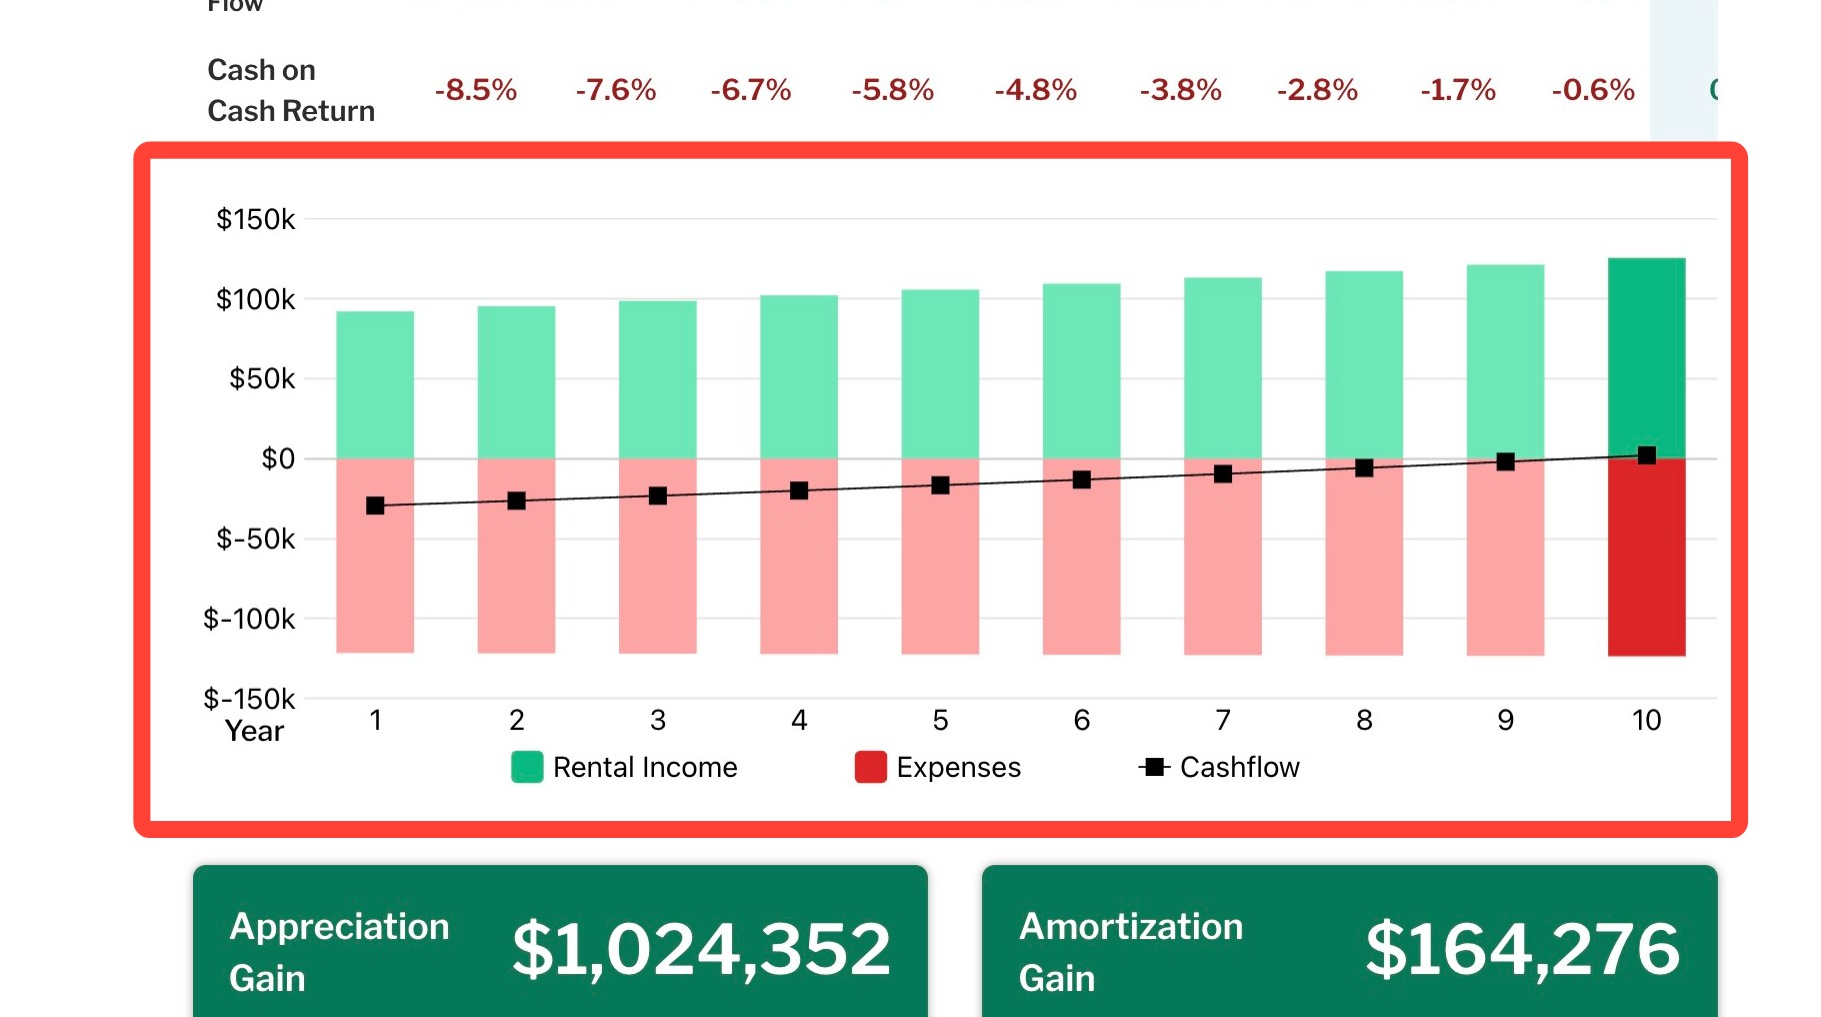
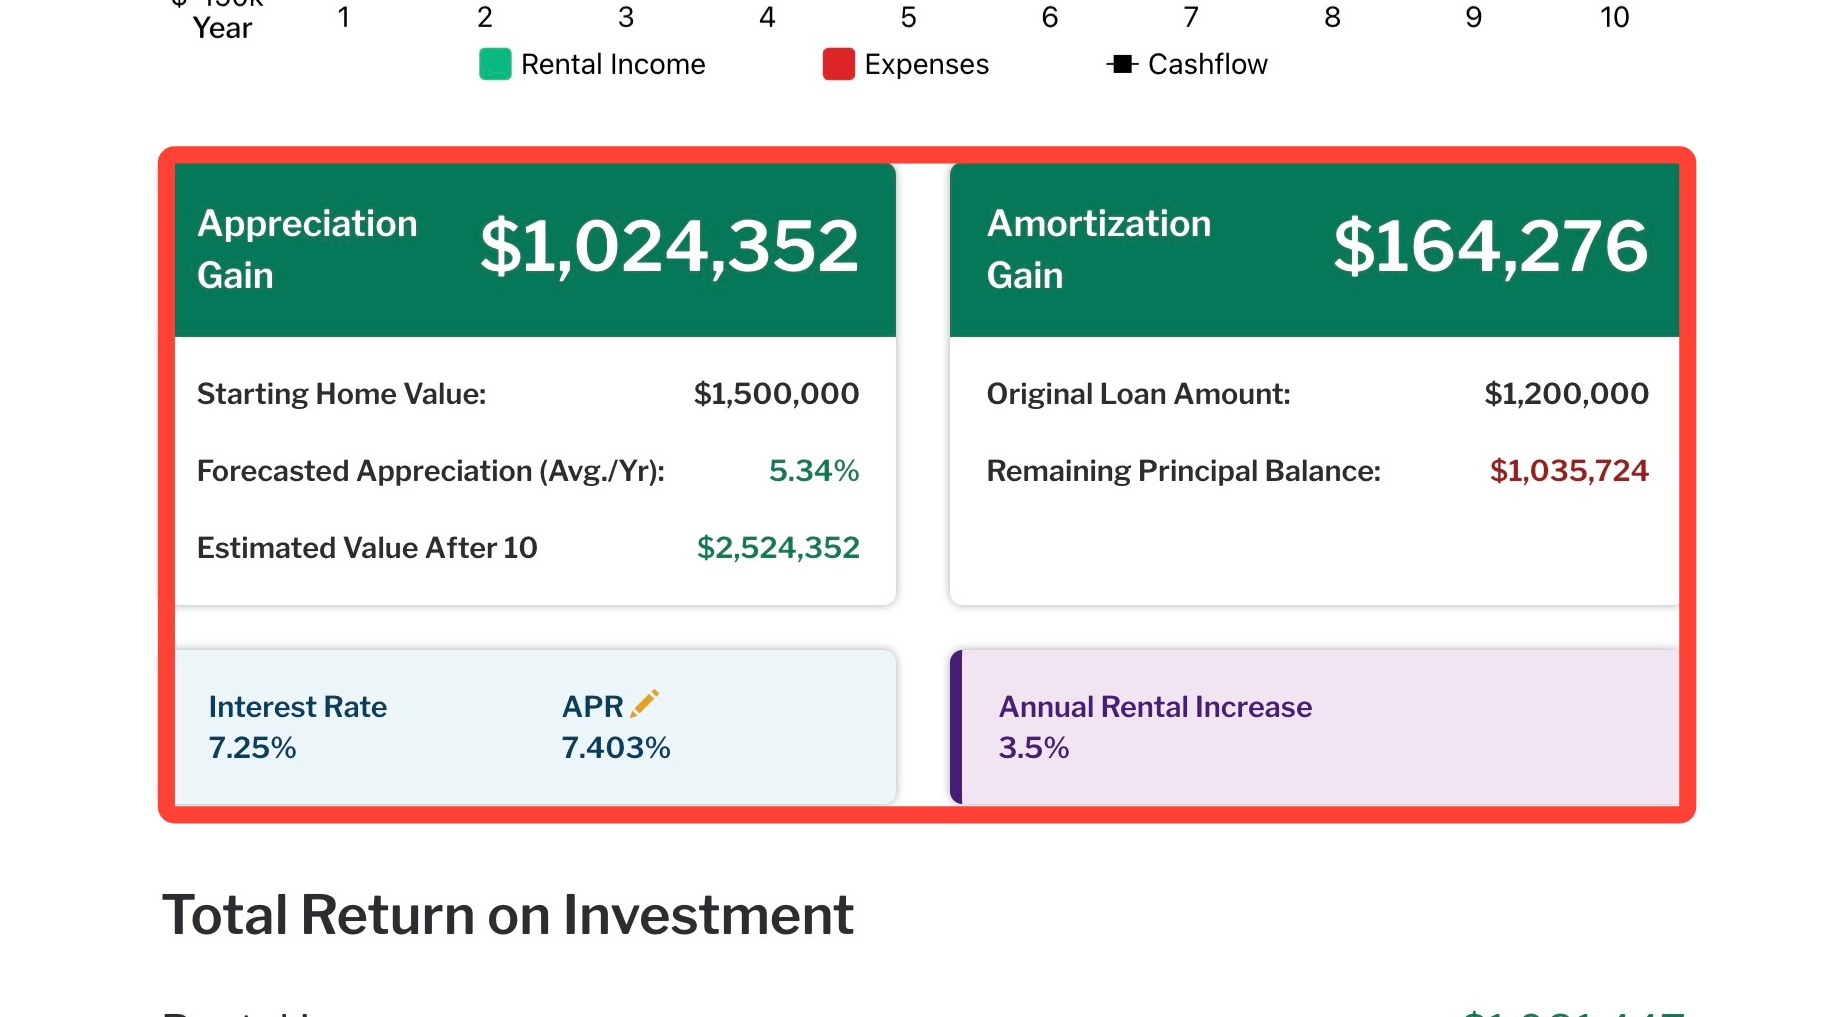
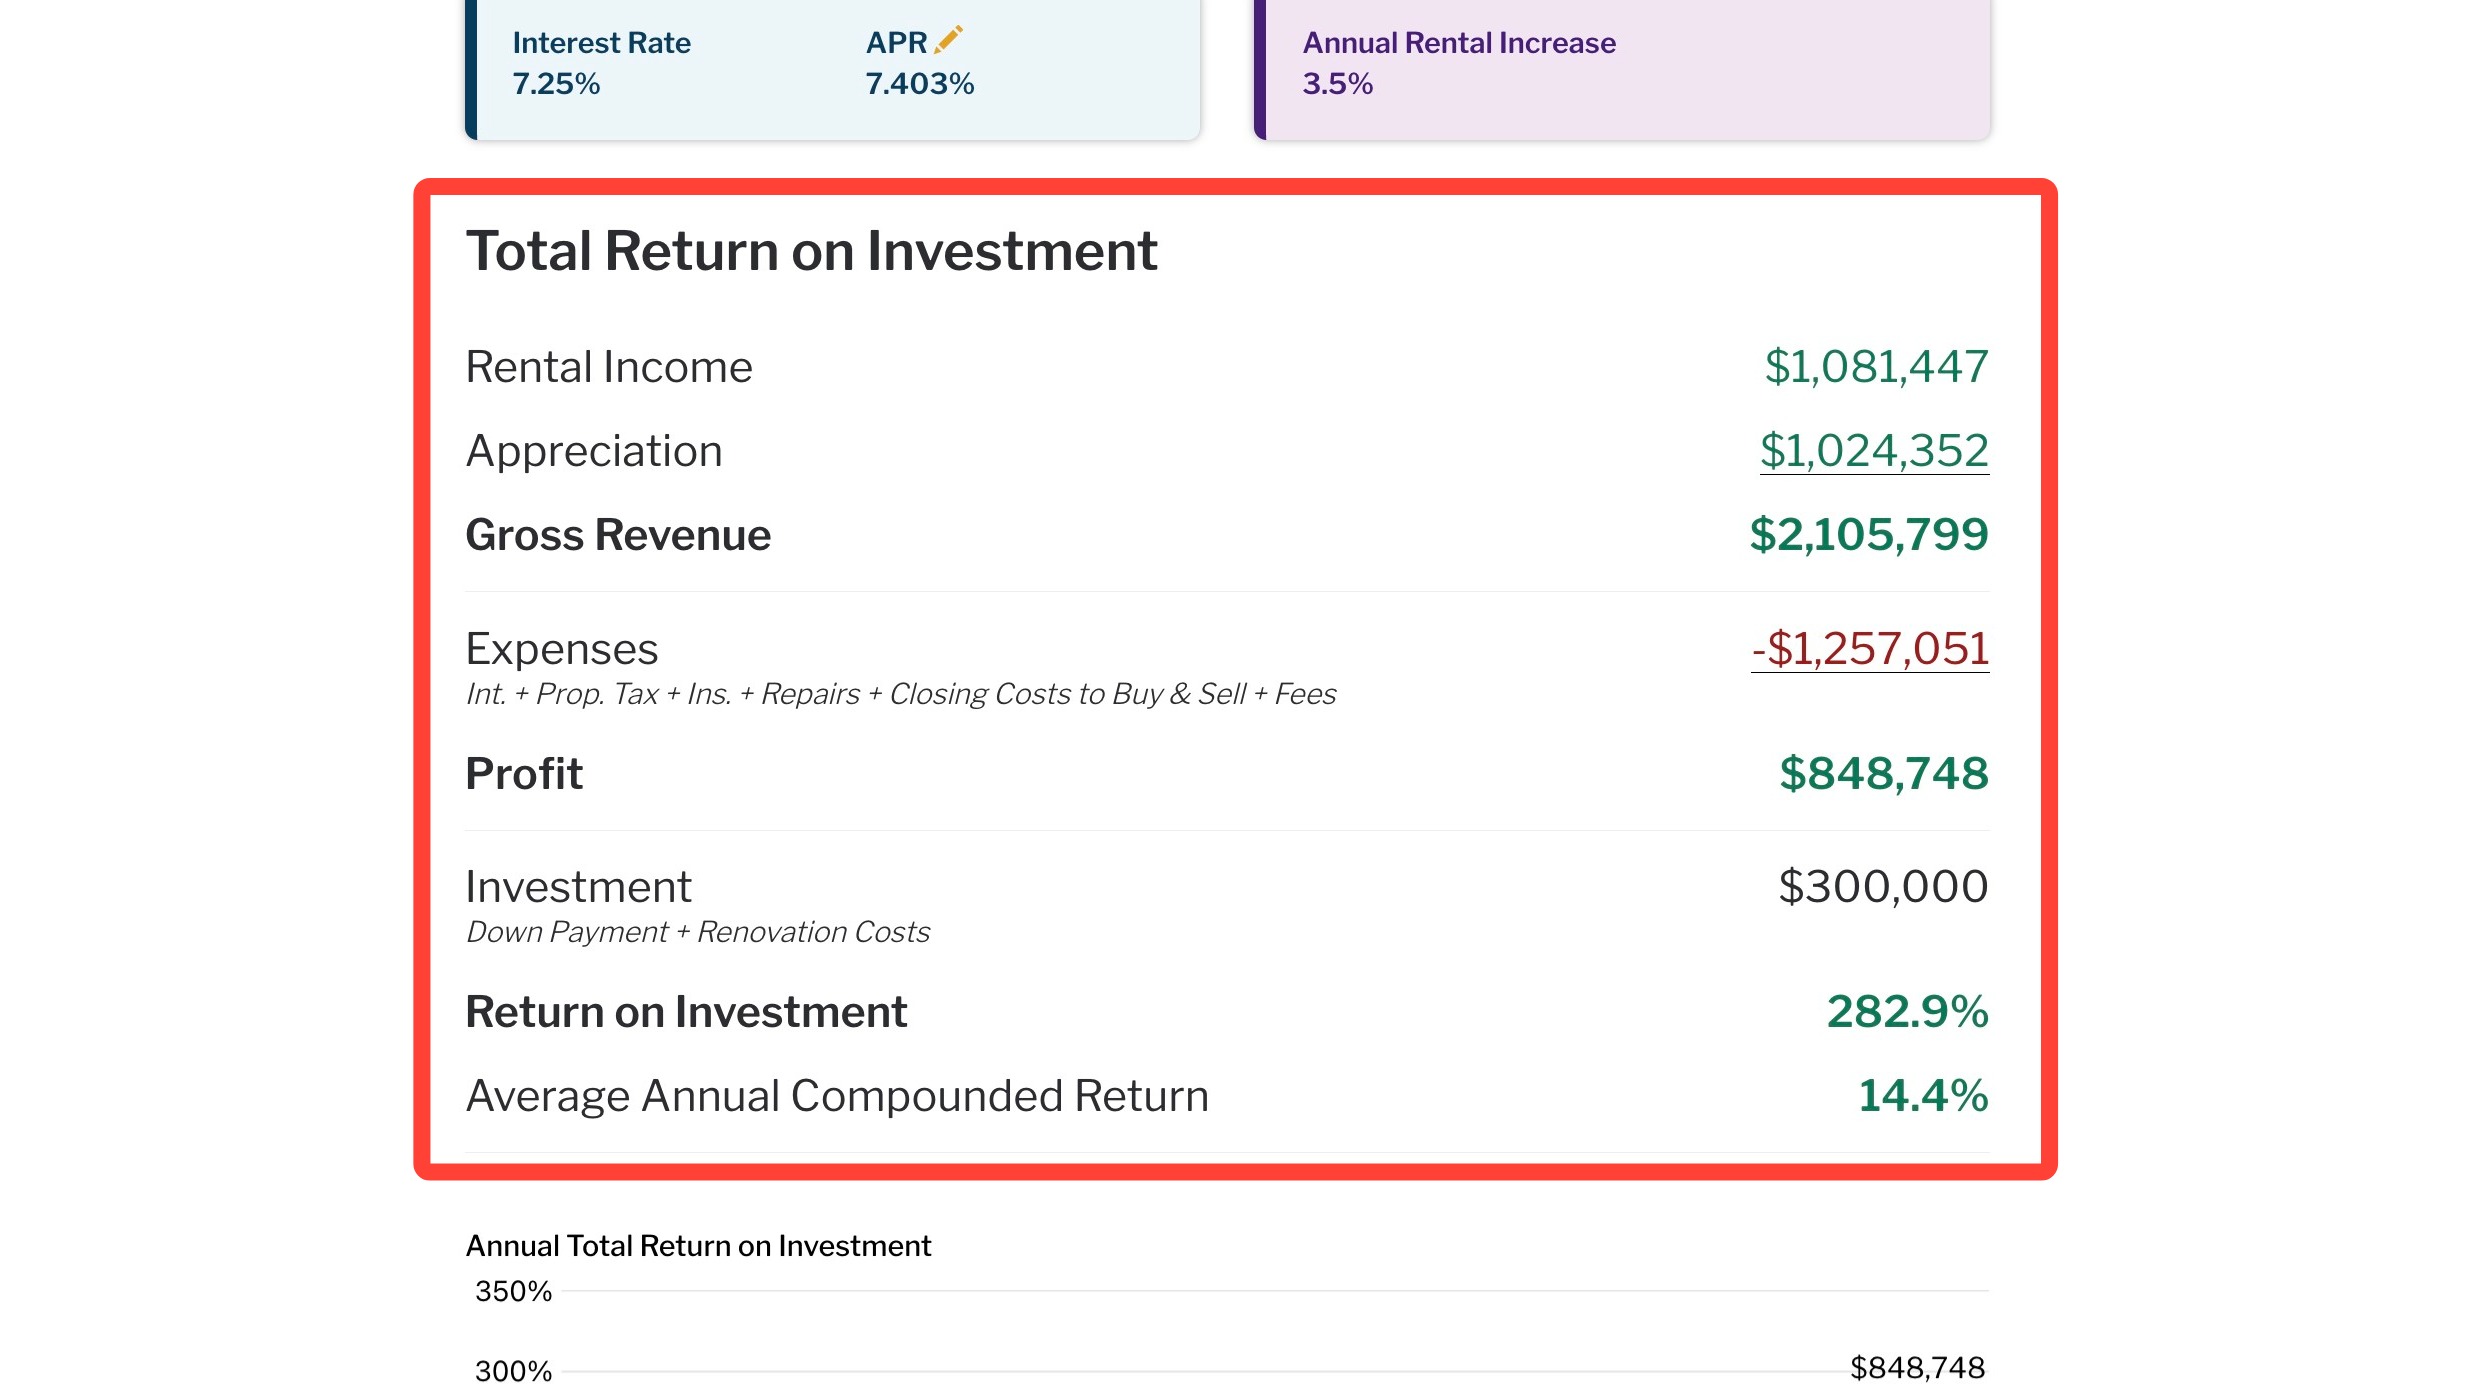
- The report highlights the total Appreciation and Amortization Gains, followed by the Total Return on investment. This breakdown compares the gross revenue (rental income + appreciation) to the sum of all expenses to calculate the total profit. It then considers this profit as a percentage of the amount invested (down payment + renovation costs) to calculate the return on investment.
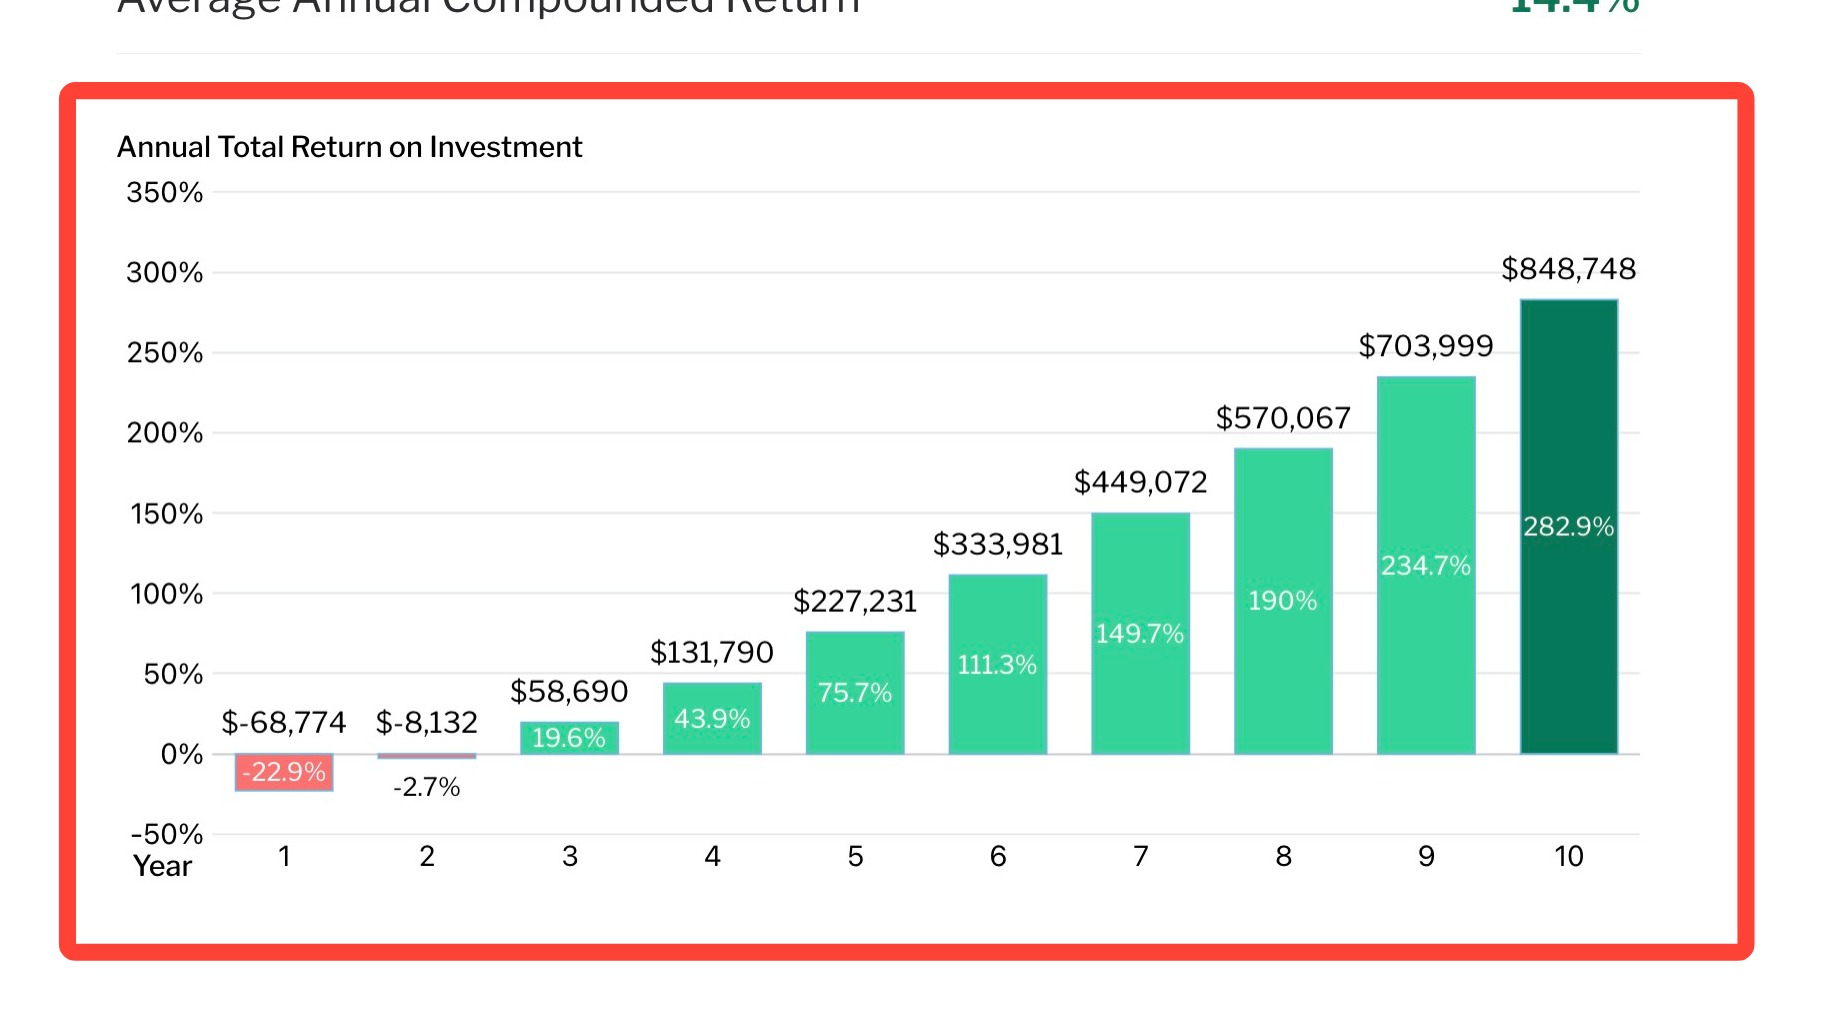
- This chart illustrates the Annual Total Return on Investment through each year of home ownership.
Need Help?
Click here to submit a support ticket.
Related to