The Equity Gained report projects up to 15 years of potential home equity using selected appreciation models, comparing scenarios like Forecasted and Historical Appreciation. Accessible via Client Manager or the Real Estate sidebar, it summarizes equity gained from appreciation and amortization, visualized with graphs showing home value growth and loan balance over time. Helpful tips and support options are provided for users.
Navigating to the Equity Gained Report
You can find your Equity Gained report within Client Manager as well as within the Real Estate sidebar menu.
Navigating through the Client Manager
Client Manager allows you to create reports for your clients using previously saved loan and property details, saving you time when building new scenarios. To learn more, click here.
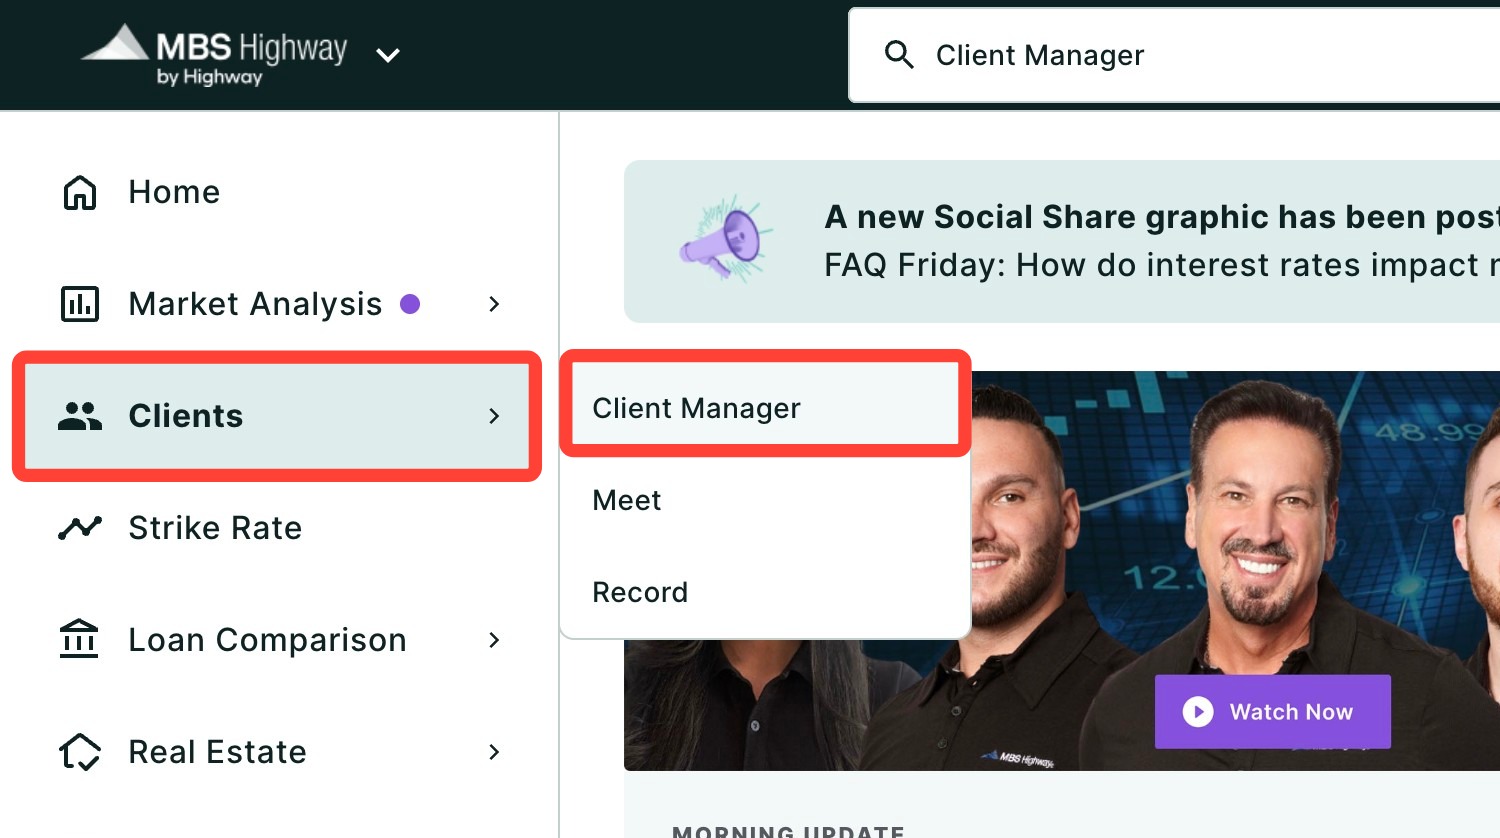
Navigating through the left-hand sidebar menu
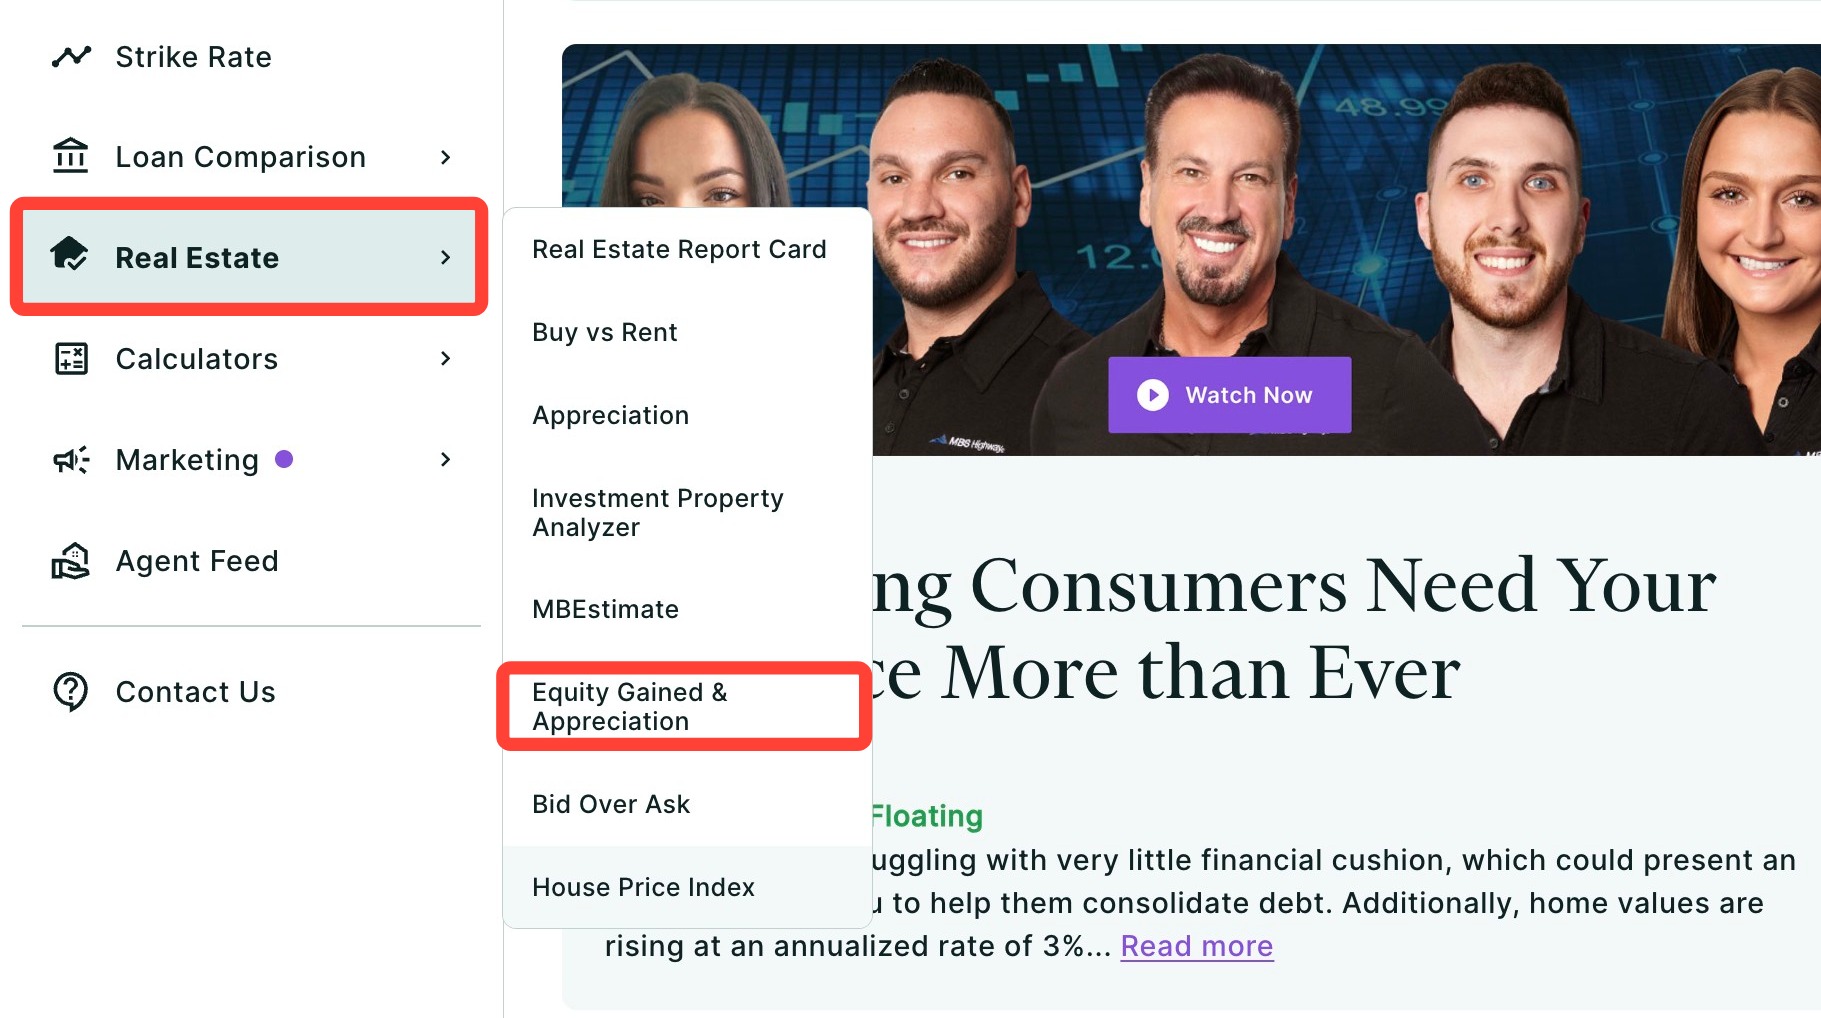
To access the Equity Gained report using the left-hand sidebar menu, click Real Estate, then click Equity Gained and Appreciation.
💡 Helpful Tip: You can also search and favorite reports, tools, and calculators. Click here to learn how. |
Equity Calculations
The top section summarizes your estimated equity, up to 15 years. You can use the toggle bar above the charts to adjust the number of years.
Each chart will display the Appreciation Gained, Amortization Gained, and Total Equity Gained.
💡 Helpful Tip: Use this section to highlight how both market growth and loan repayment contribute to long-term equity. |
Equity Visualization Graph
The bottom line graph charts home value growth with appreciation rates and the remaining loan balance over time.
Equity Chart Legend
- 🟦 🟣 Purple/Teal Line: A purple and/or teal line will be displayed for the appreciation rates you chose when building the report
- ⚫ Black Line: Remaining loan balance
- 🏠 House icons: Projected home value at each milestone (year 0, 3, 6, etc.)
- 💲 Dollar icons: Corresponding loan balance at those same milestones
Need Help?
Have questions or want to learn more? Submit a ticket or call us today!
Related to