Bid Over Asking Price will give your clients a clear understanding of how many months it will take them to recoup any costs they used to bid over the asking price, and how the home will continue to appreciate over time. To learn how to create your report, click here.
Below is a breakdown of each section in the report.
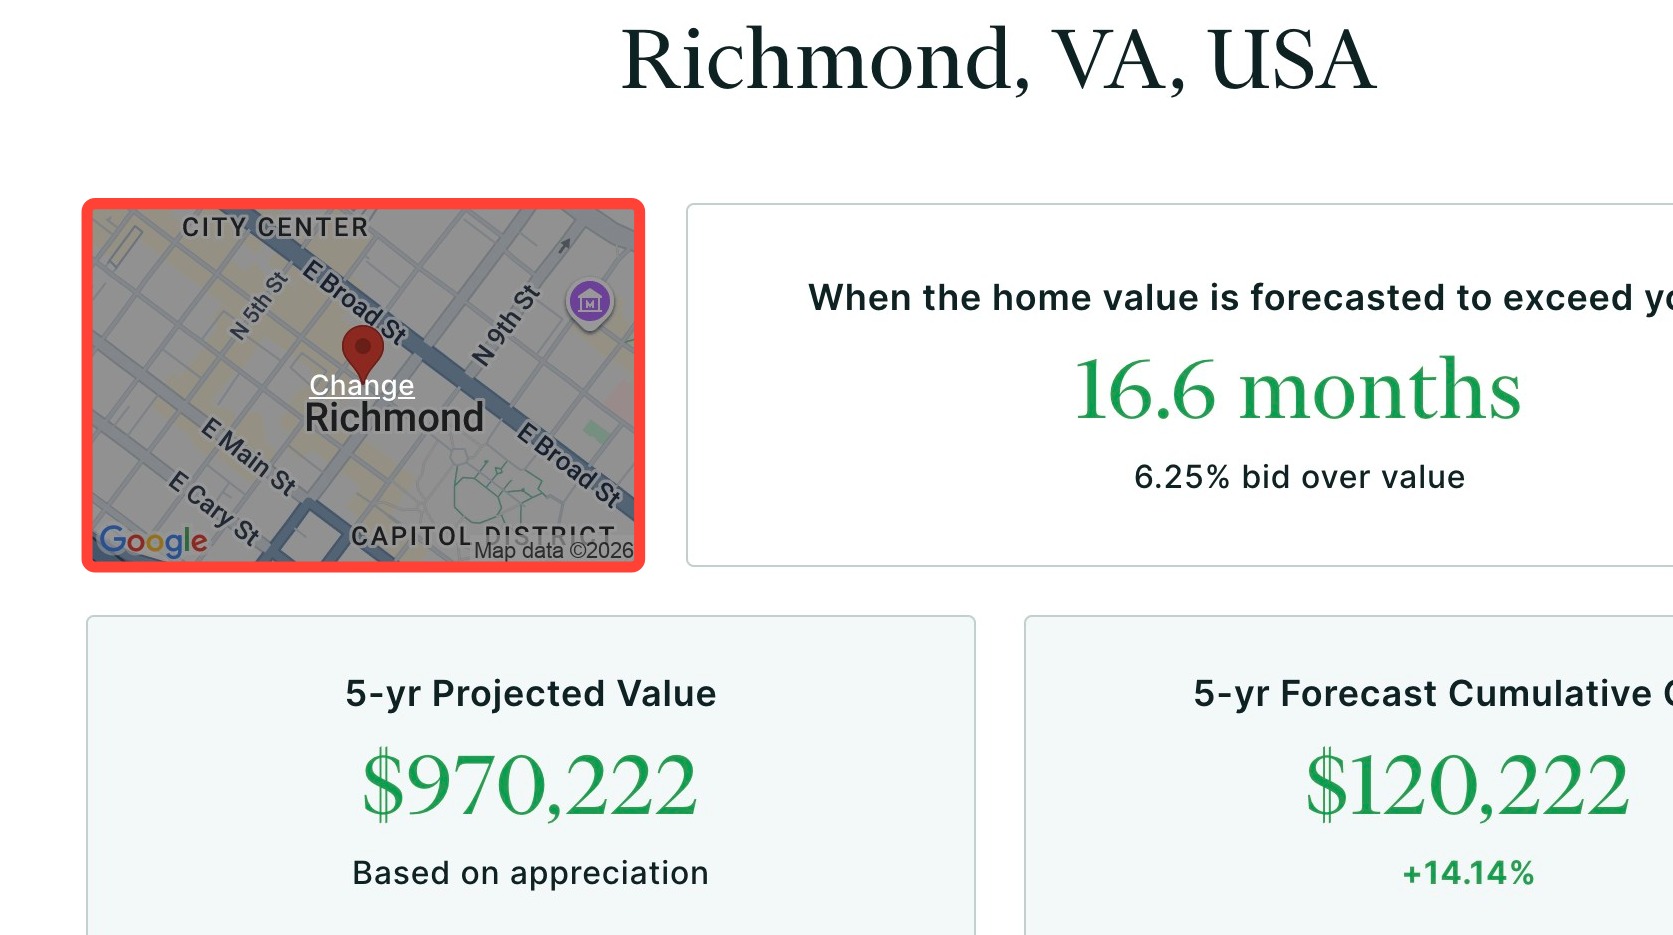
Location and Property Image
This image defaults to a map view of the property location. You can replace it with your own image, so you can personalize the report and provide a more engaging visual for your client. To do so, follow the steps below:
- Click the image.
- Select Upload.
- Choose a photo from your computer.
- Click Save to update the report.
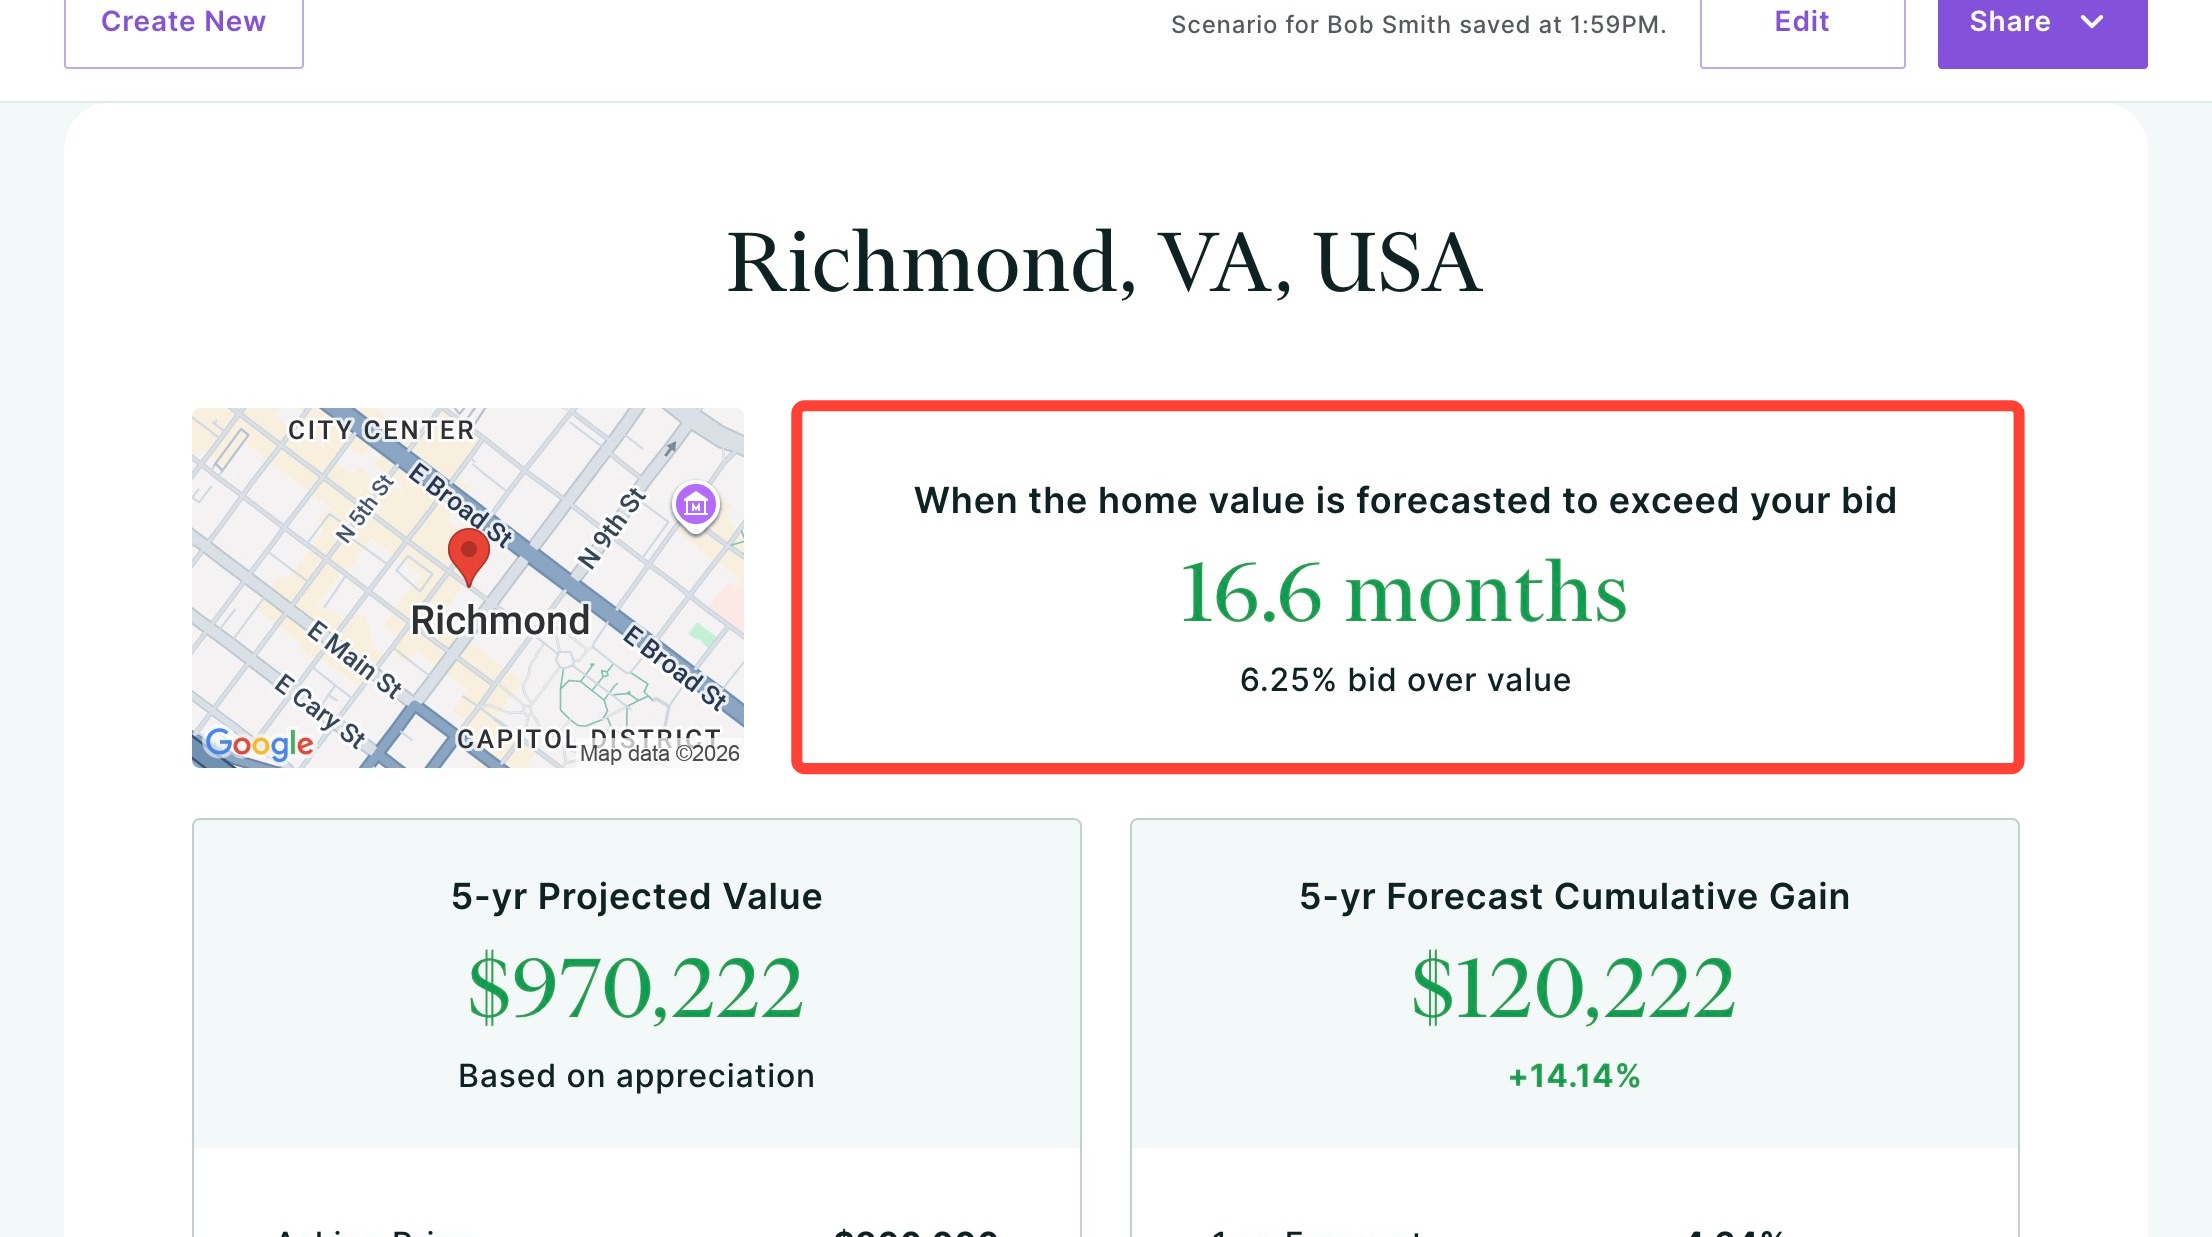
Break-Even Timeline
This section shows how many months it is forecasted to take for the home’s value to exceed your client’s total bid amount. This helps clients understand how long it may take to recover the additional amount offered above asking price through home appreciation.
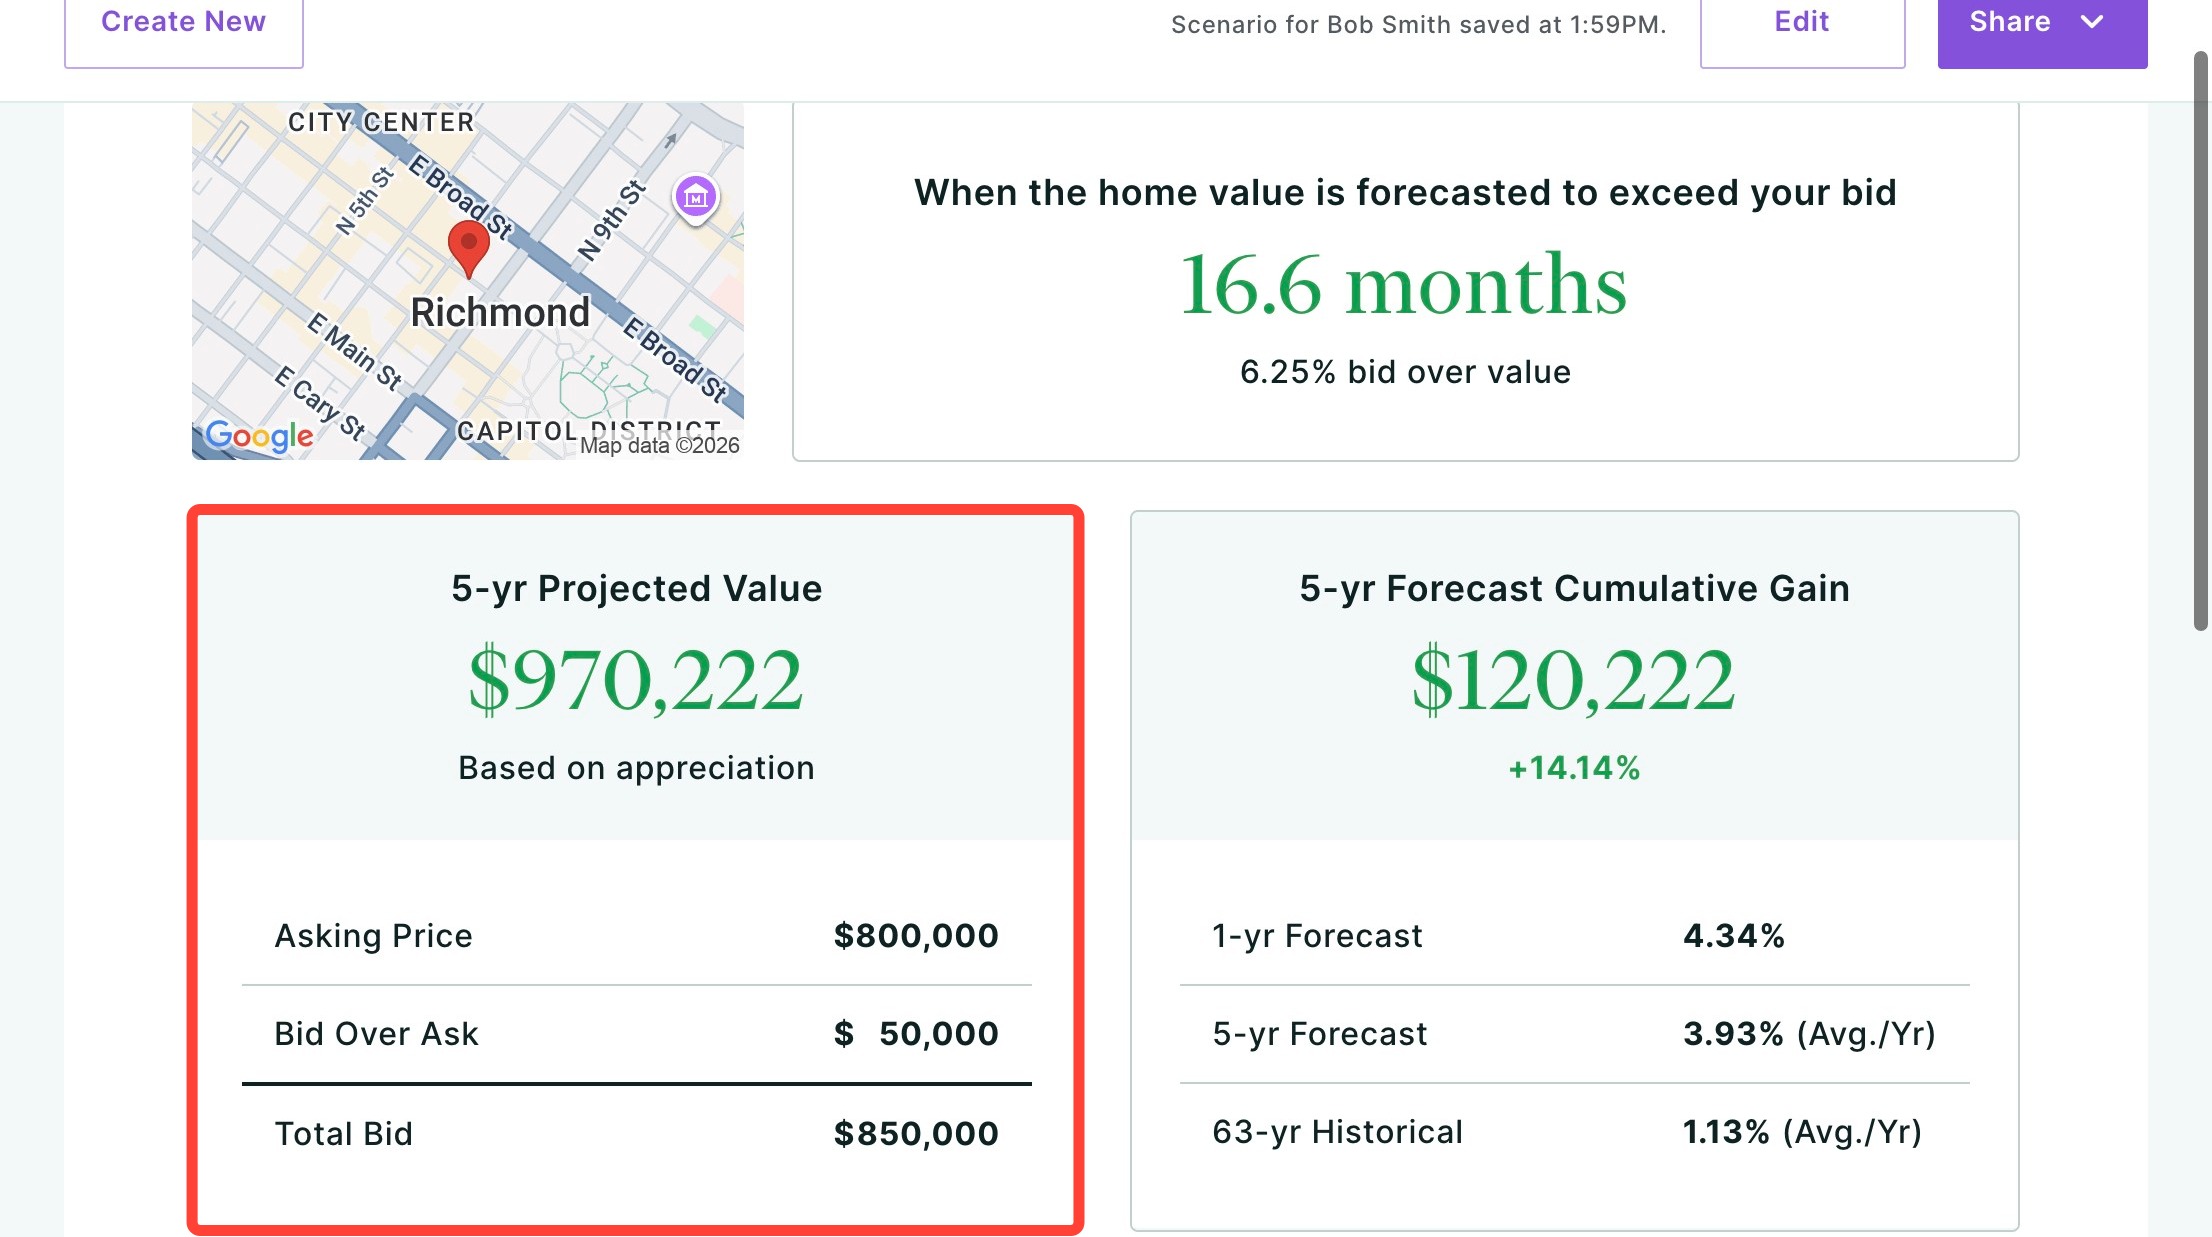
5-Year Projected Value
This section shows the projected home value after five years based on the selected appreciation model.
It also displays:
- Asking Price: The property’s original listing price
- Bid Over Ask: The amount offered above asking price
- Total Bid: The combined total of the asking price and bid over amount
This helps clients visualize how their purchase compares to the projected future value.
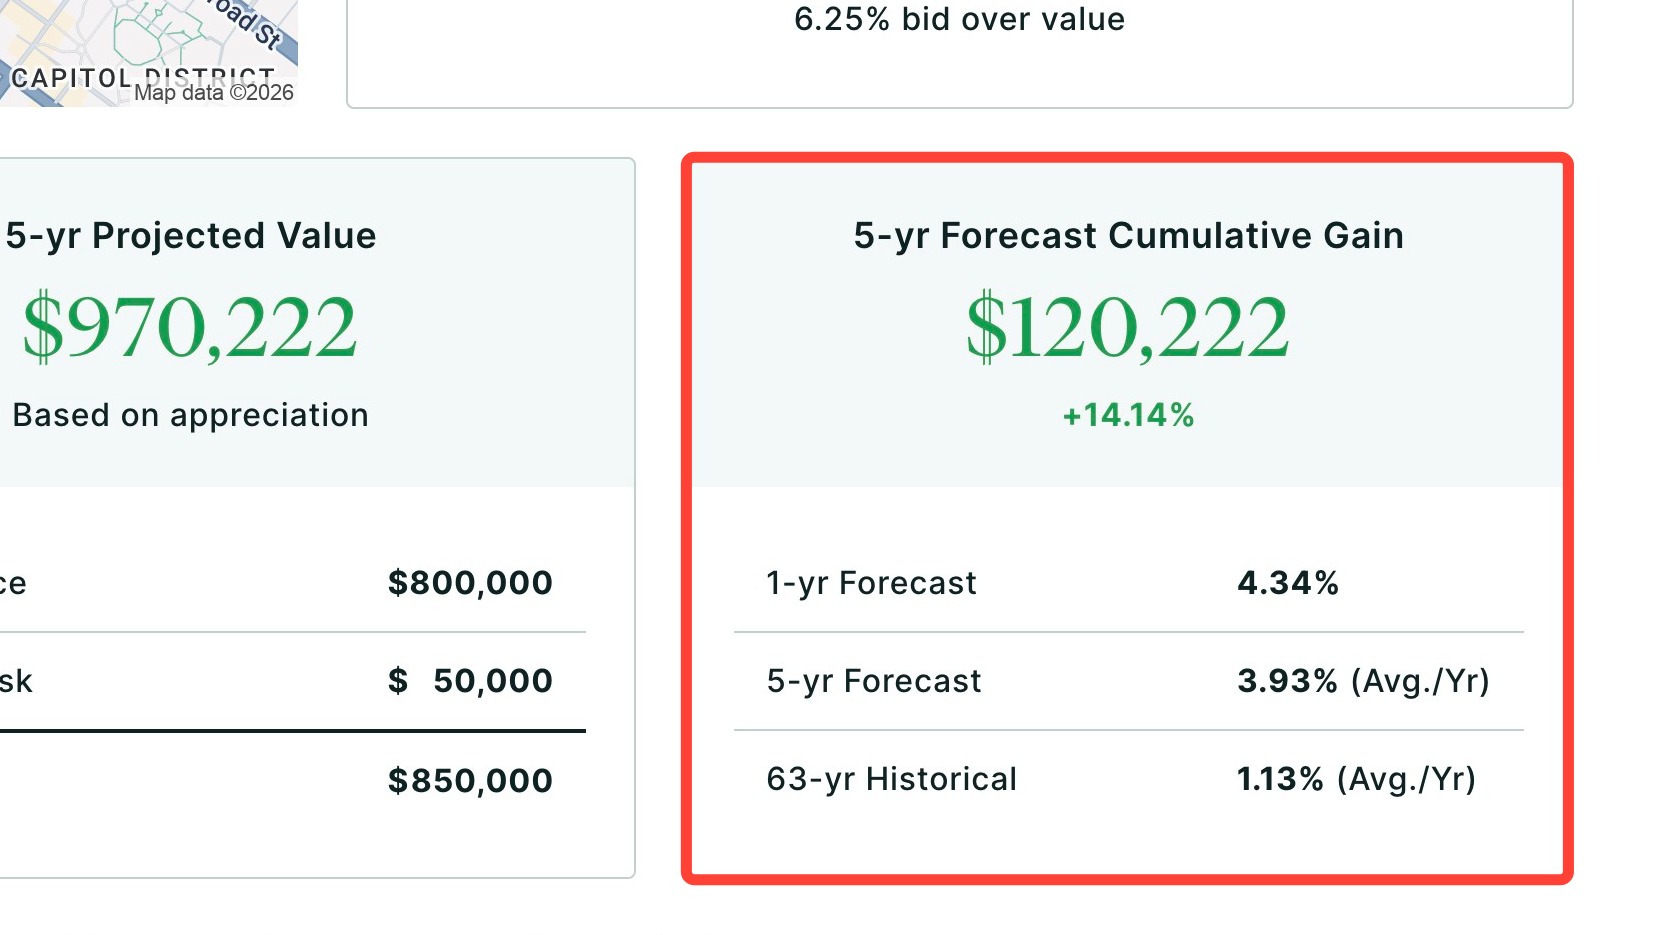
5-yr Forecast Cumulative Gain
This section shows the total cumulative estimated appreciation in both dollar amount and percentage over five years.
It also includes appreciation benchmarks:
- 1-Year Forecast: Projected appreciation over the next year
- 5-Year Forecast: Average annual appreciation forecast over five years
- Historical Average: Long-term historical appreciation average
This helps clients visualize how appreciation over time contributes to their long-term equity and cumulative gains.
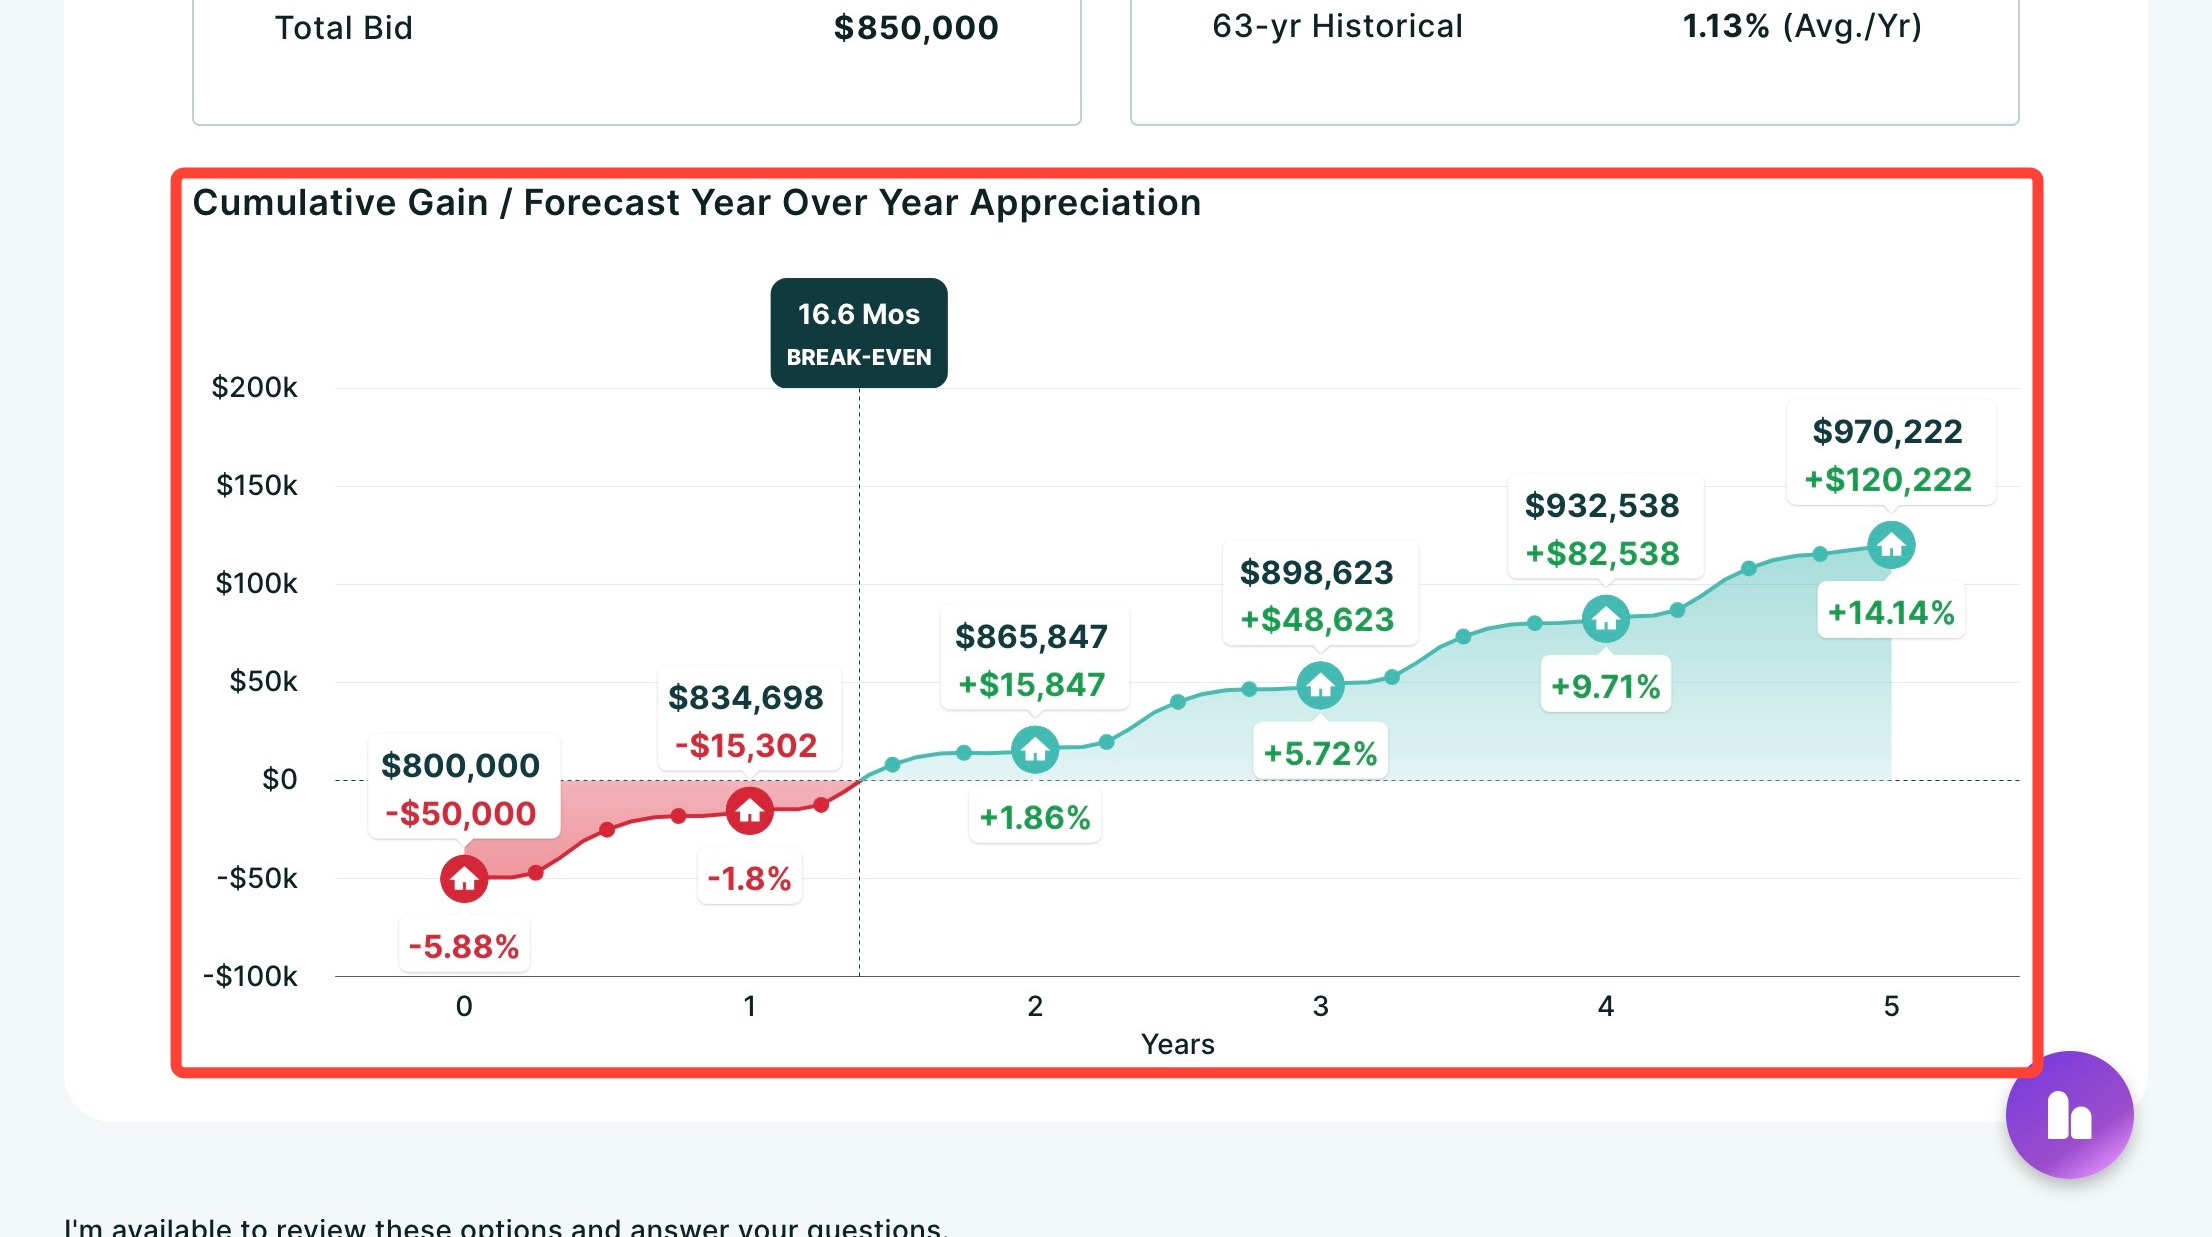
Cumulative Gain / Forecast Year Over Year Appreciation
This chart visually shows the projected home value over five years.
It highlights:
- The home’s starting value relative to the total bid
- Projected appreciation year-by-year
- When the home’s value is forecasted to exceed the total bid amount (break-even point)
- Estimated cumulative gains over time
Red indicates when the home value is below the total bid. Green indicates when the home value exceeds the total bid and equity has been gained.
This visual helps clients clearly understand the long-term impact of bidding above asking price.
Have questions or want to learn more? Submit a ticket or call us today!