The Seller Contribution tool allows you to compare the difference in cost and benefit between price reductions, temporary buydowns, permanent buydowns, and seller paid closing costs. Continue reading to learn more about what you can find inside the Seller Contribution report.
Navigating to the Seller Contribution Report
You can find your Seller Contribution report within the Loan Comparison tab of the left-hand navigation menu.
Navigating through the left-hand sidebar menu
To access the Seller Contribution report using the left-hand sidebar menu, click Loan Comparison, then click Seller Contribution.
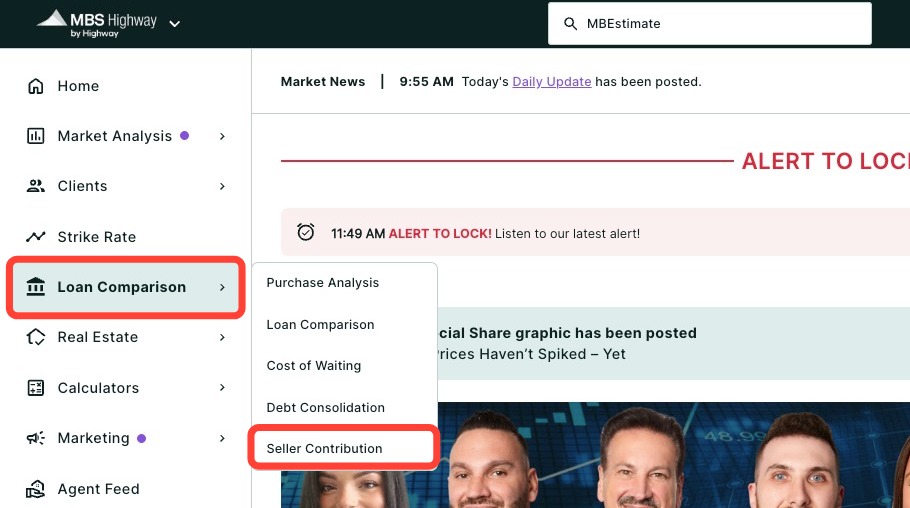
💡 Helpful Tip: You can favorite the Seller Contribution report by clicking the star next to its name, so it's easier to find next time.
|
What's Inside Your Seller Contribution Report
- The My Property chart shows all the specific details of each selected contribution scenario. You can highlight specific cells by clicking on them. Click Clear highlights to remove all highlights.
- The Seller Costs/Buyer Benefits for each contribution scenario are clearly presented for easy understanding by your client.
- The Lowest Payment chart shows which option will cost your customer the least amount of money over the number of years selected. Each option is highlighted in a different color on the graph. The options shown in this chart includes the cumulative principle, interest, taxes, insurance, and HOA fees (if applicable).
- You can toggle each scenario to be displayed or hidden on the graph simply by clicking on the corresponding square below the chart (see below).
- You can toggle each scenario to be displayed or hidden on the graph simply by clicking on the corresponding square below the chart (see below).
- The Summary shows a full breakdown of each option. The breakdown includes:
- Seller Costs/Buyer Benefits
- Closing Cost
- Interest
- Principal
Please note: Numbers in Green denote a Benefit vs No Contribution. Numbers in Red denote a Loss vs No Contribution.
Need Help?
Have questions or want to learn more? Submit a ticket or call us today!