This article explains what each section of the MBe$timate report shows, including the estimated home value, property details, recent sales, and neighborhood market trends.
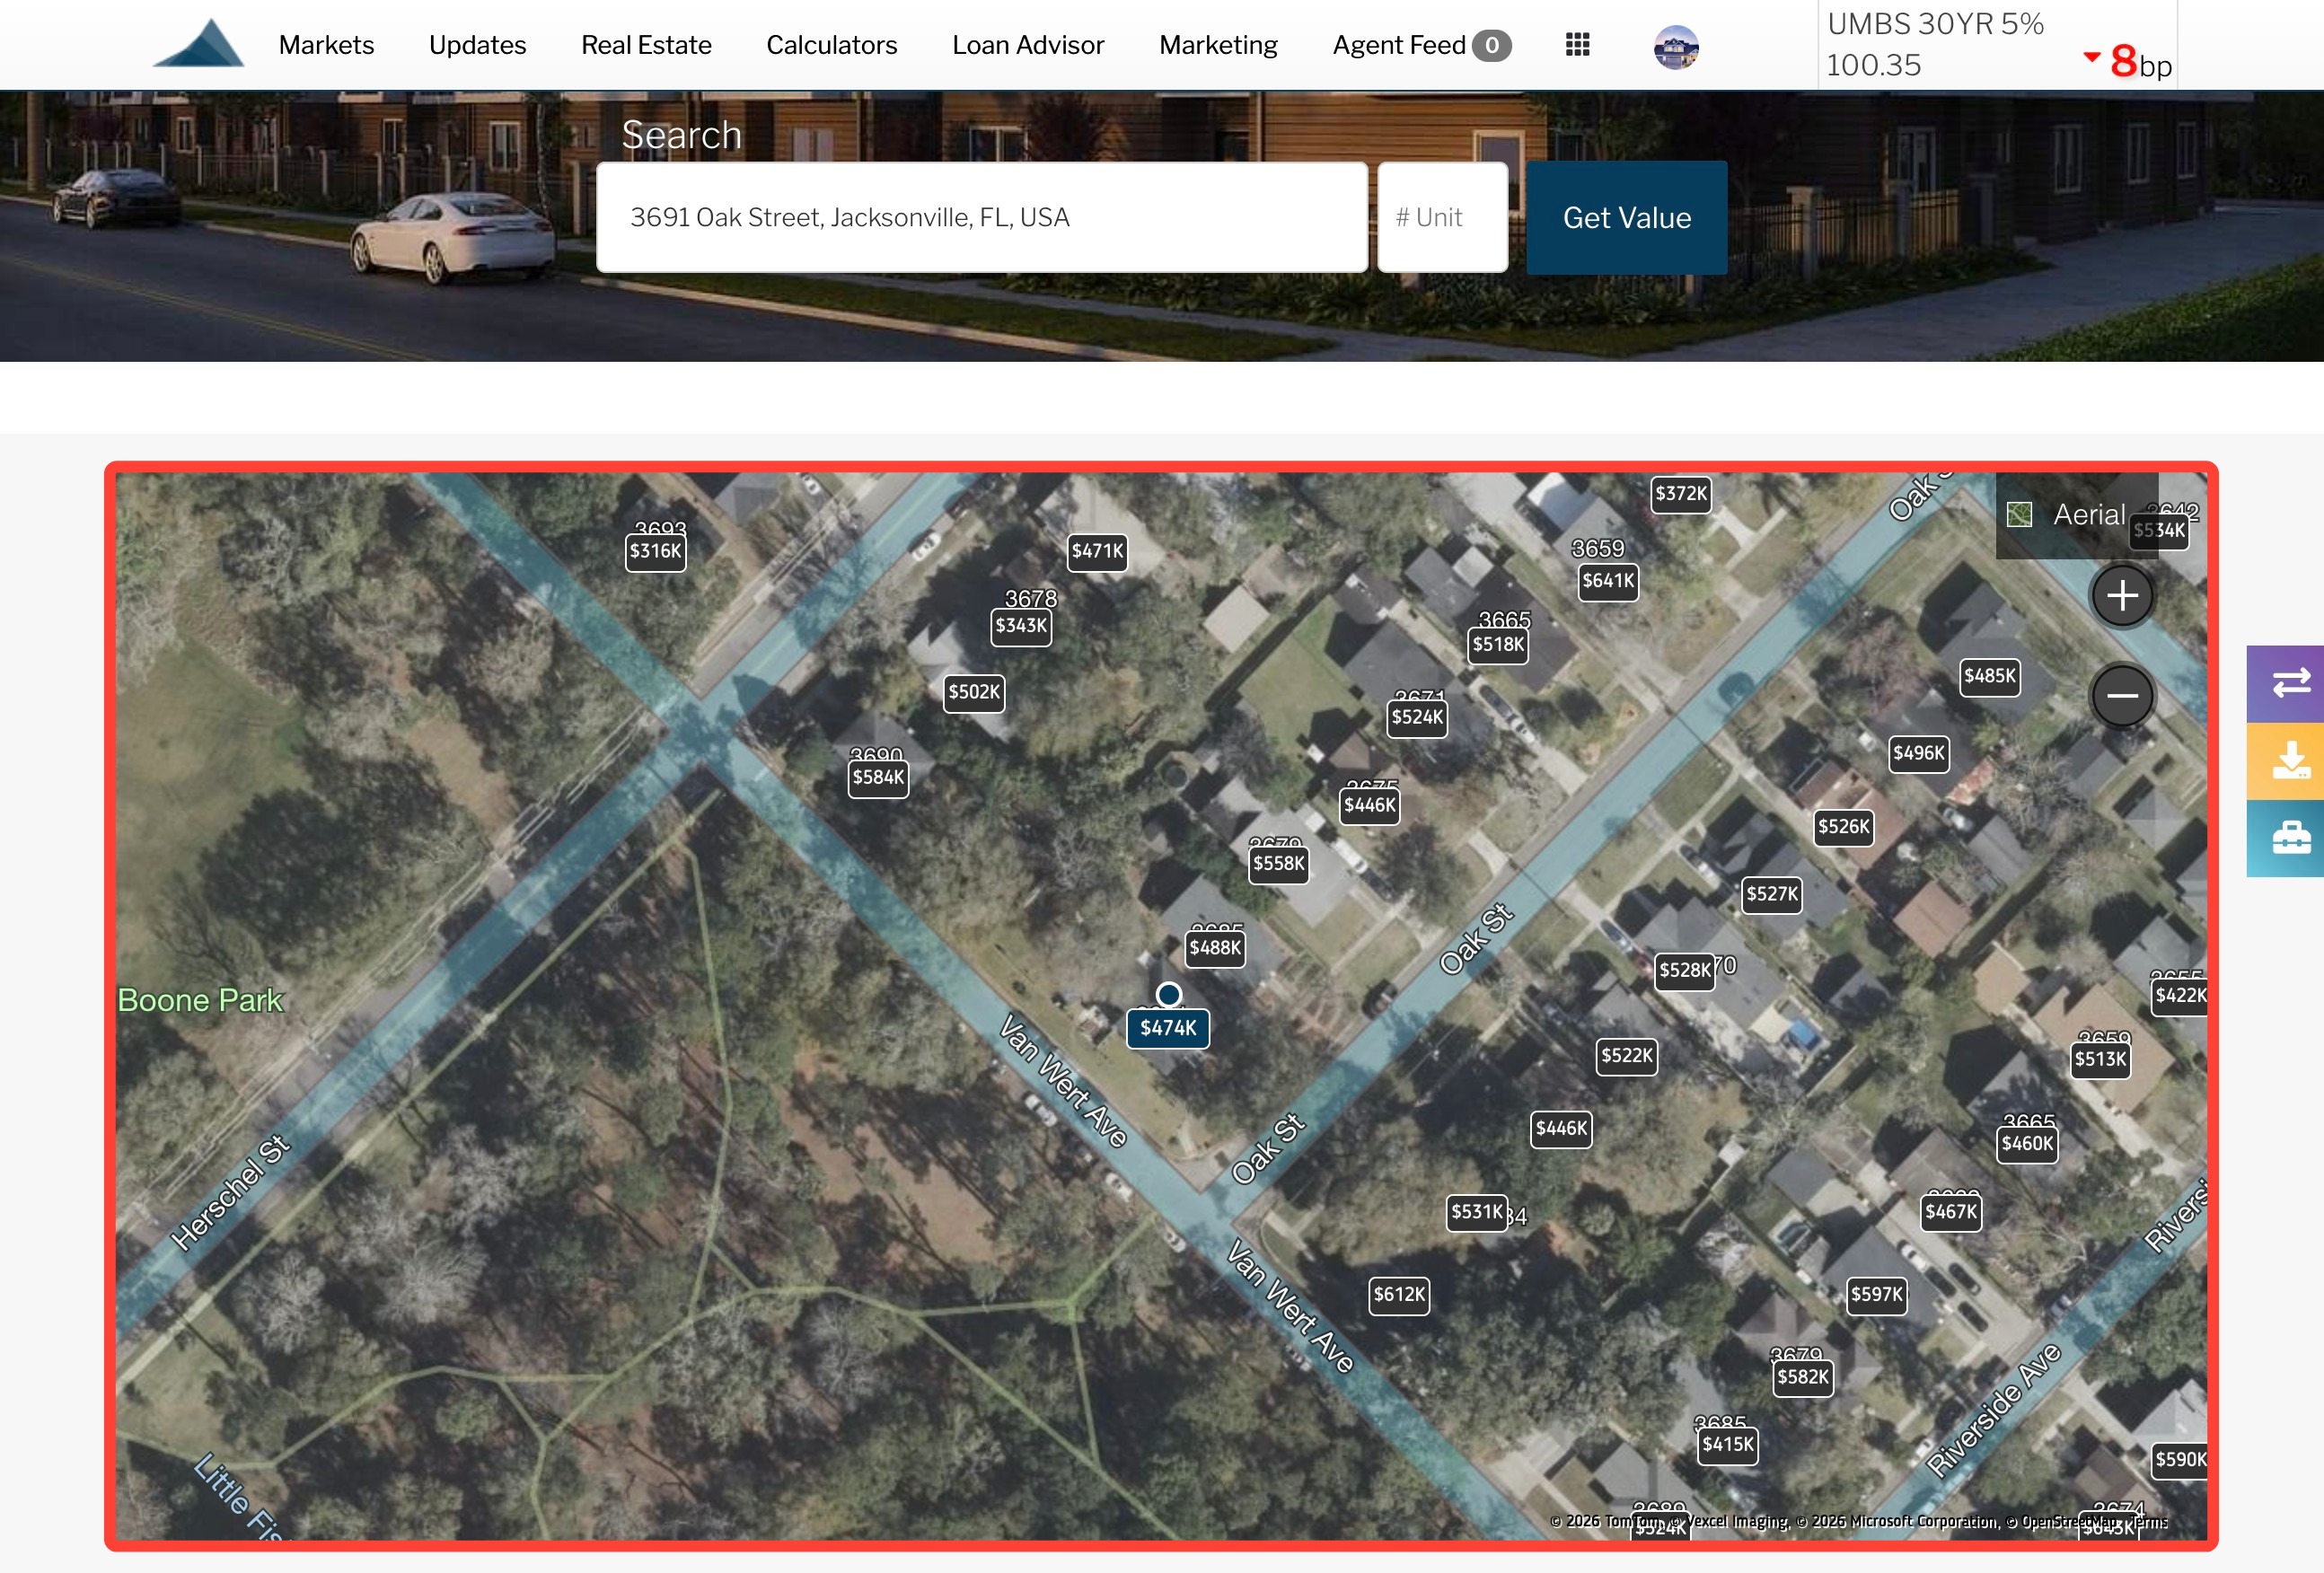
Satellite View
Shows a satellite view of the subject property and surrounding neighborhood, along with estimated values for nearby homes. Click the image to switch to street view and explore the area.
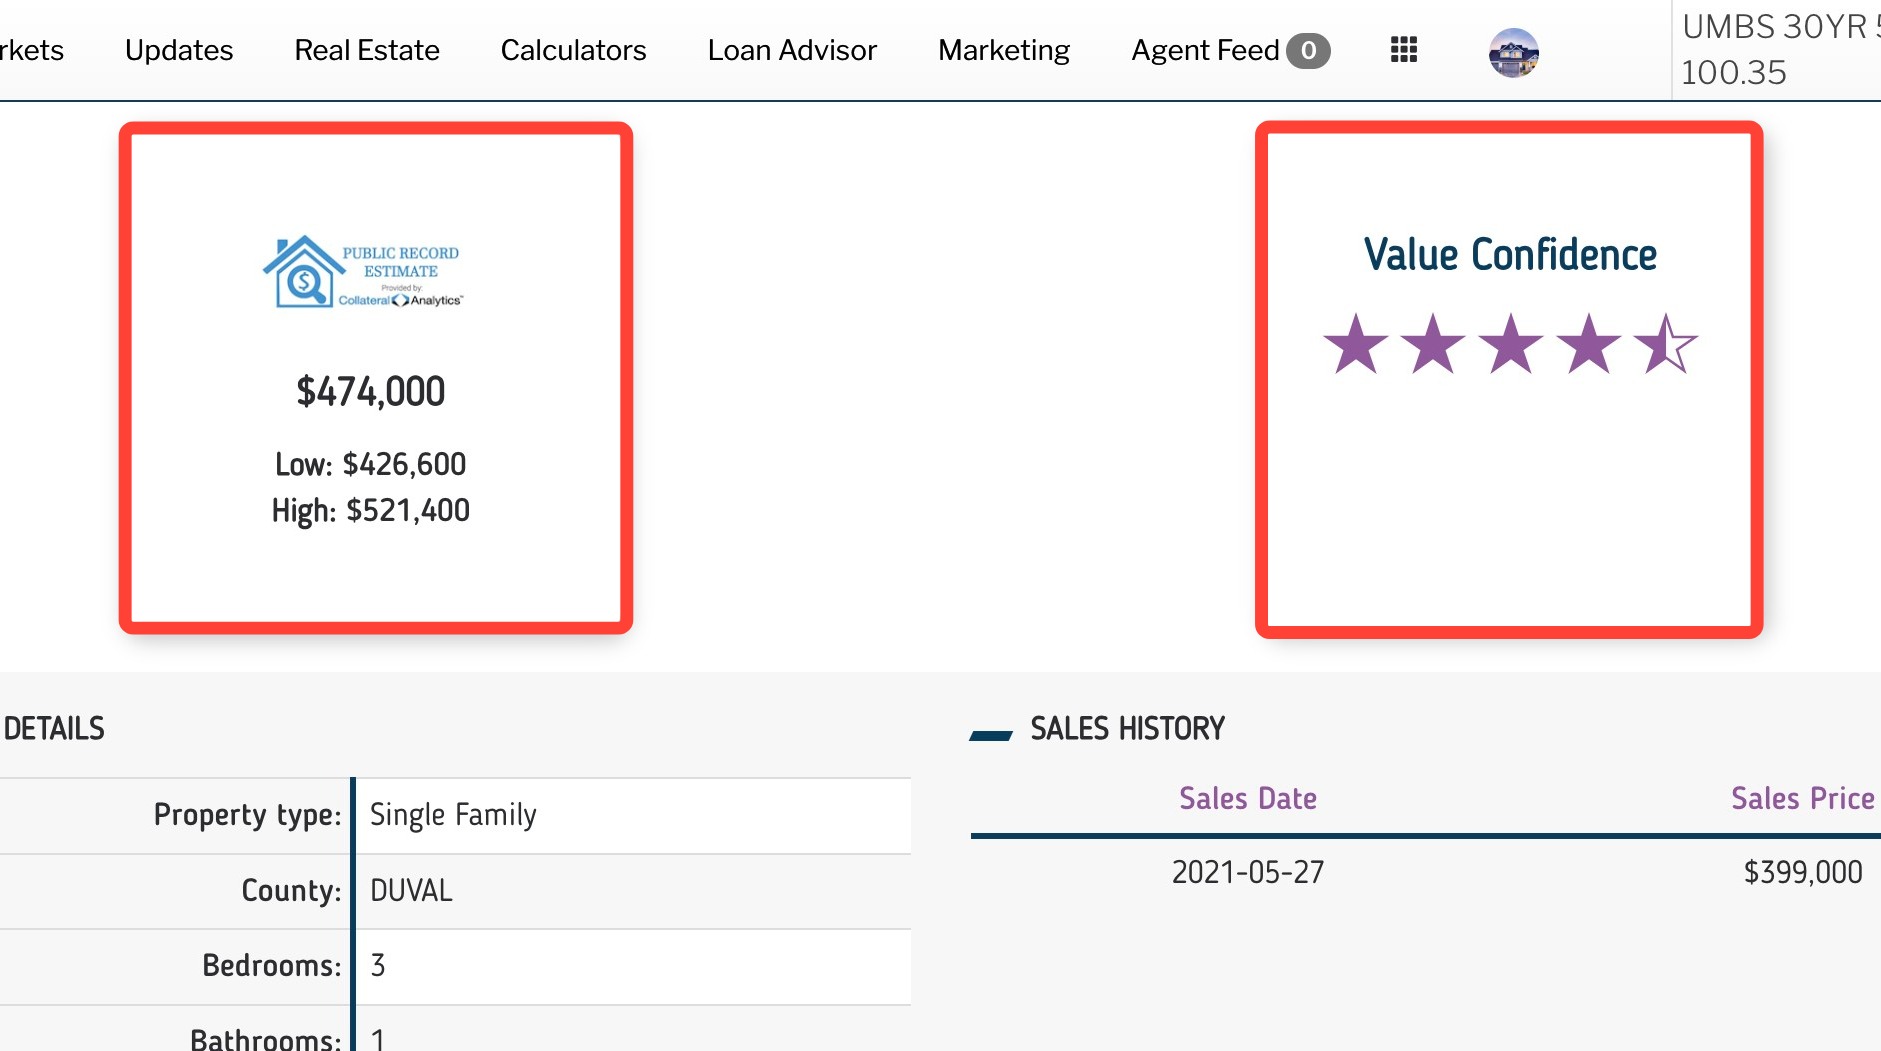
Current Estimated Value and Value Confidence
Shows the estimated current value of the home, along with a low and high range. This helps you understand the home’s approximate value and the expected range the estimate may fall within. To the right is the Value Confidence rating, which indicates how confident the data provider is with their estimate based on various factors.
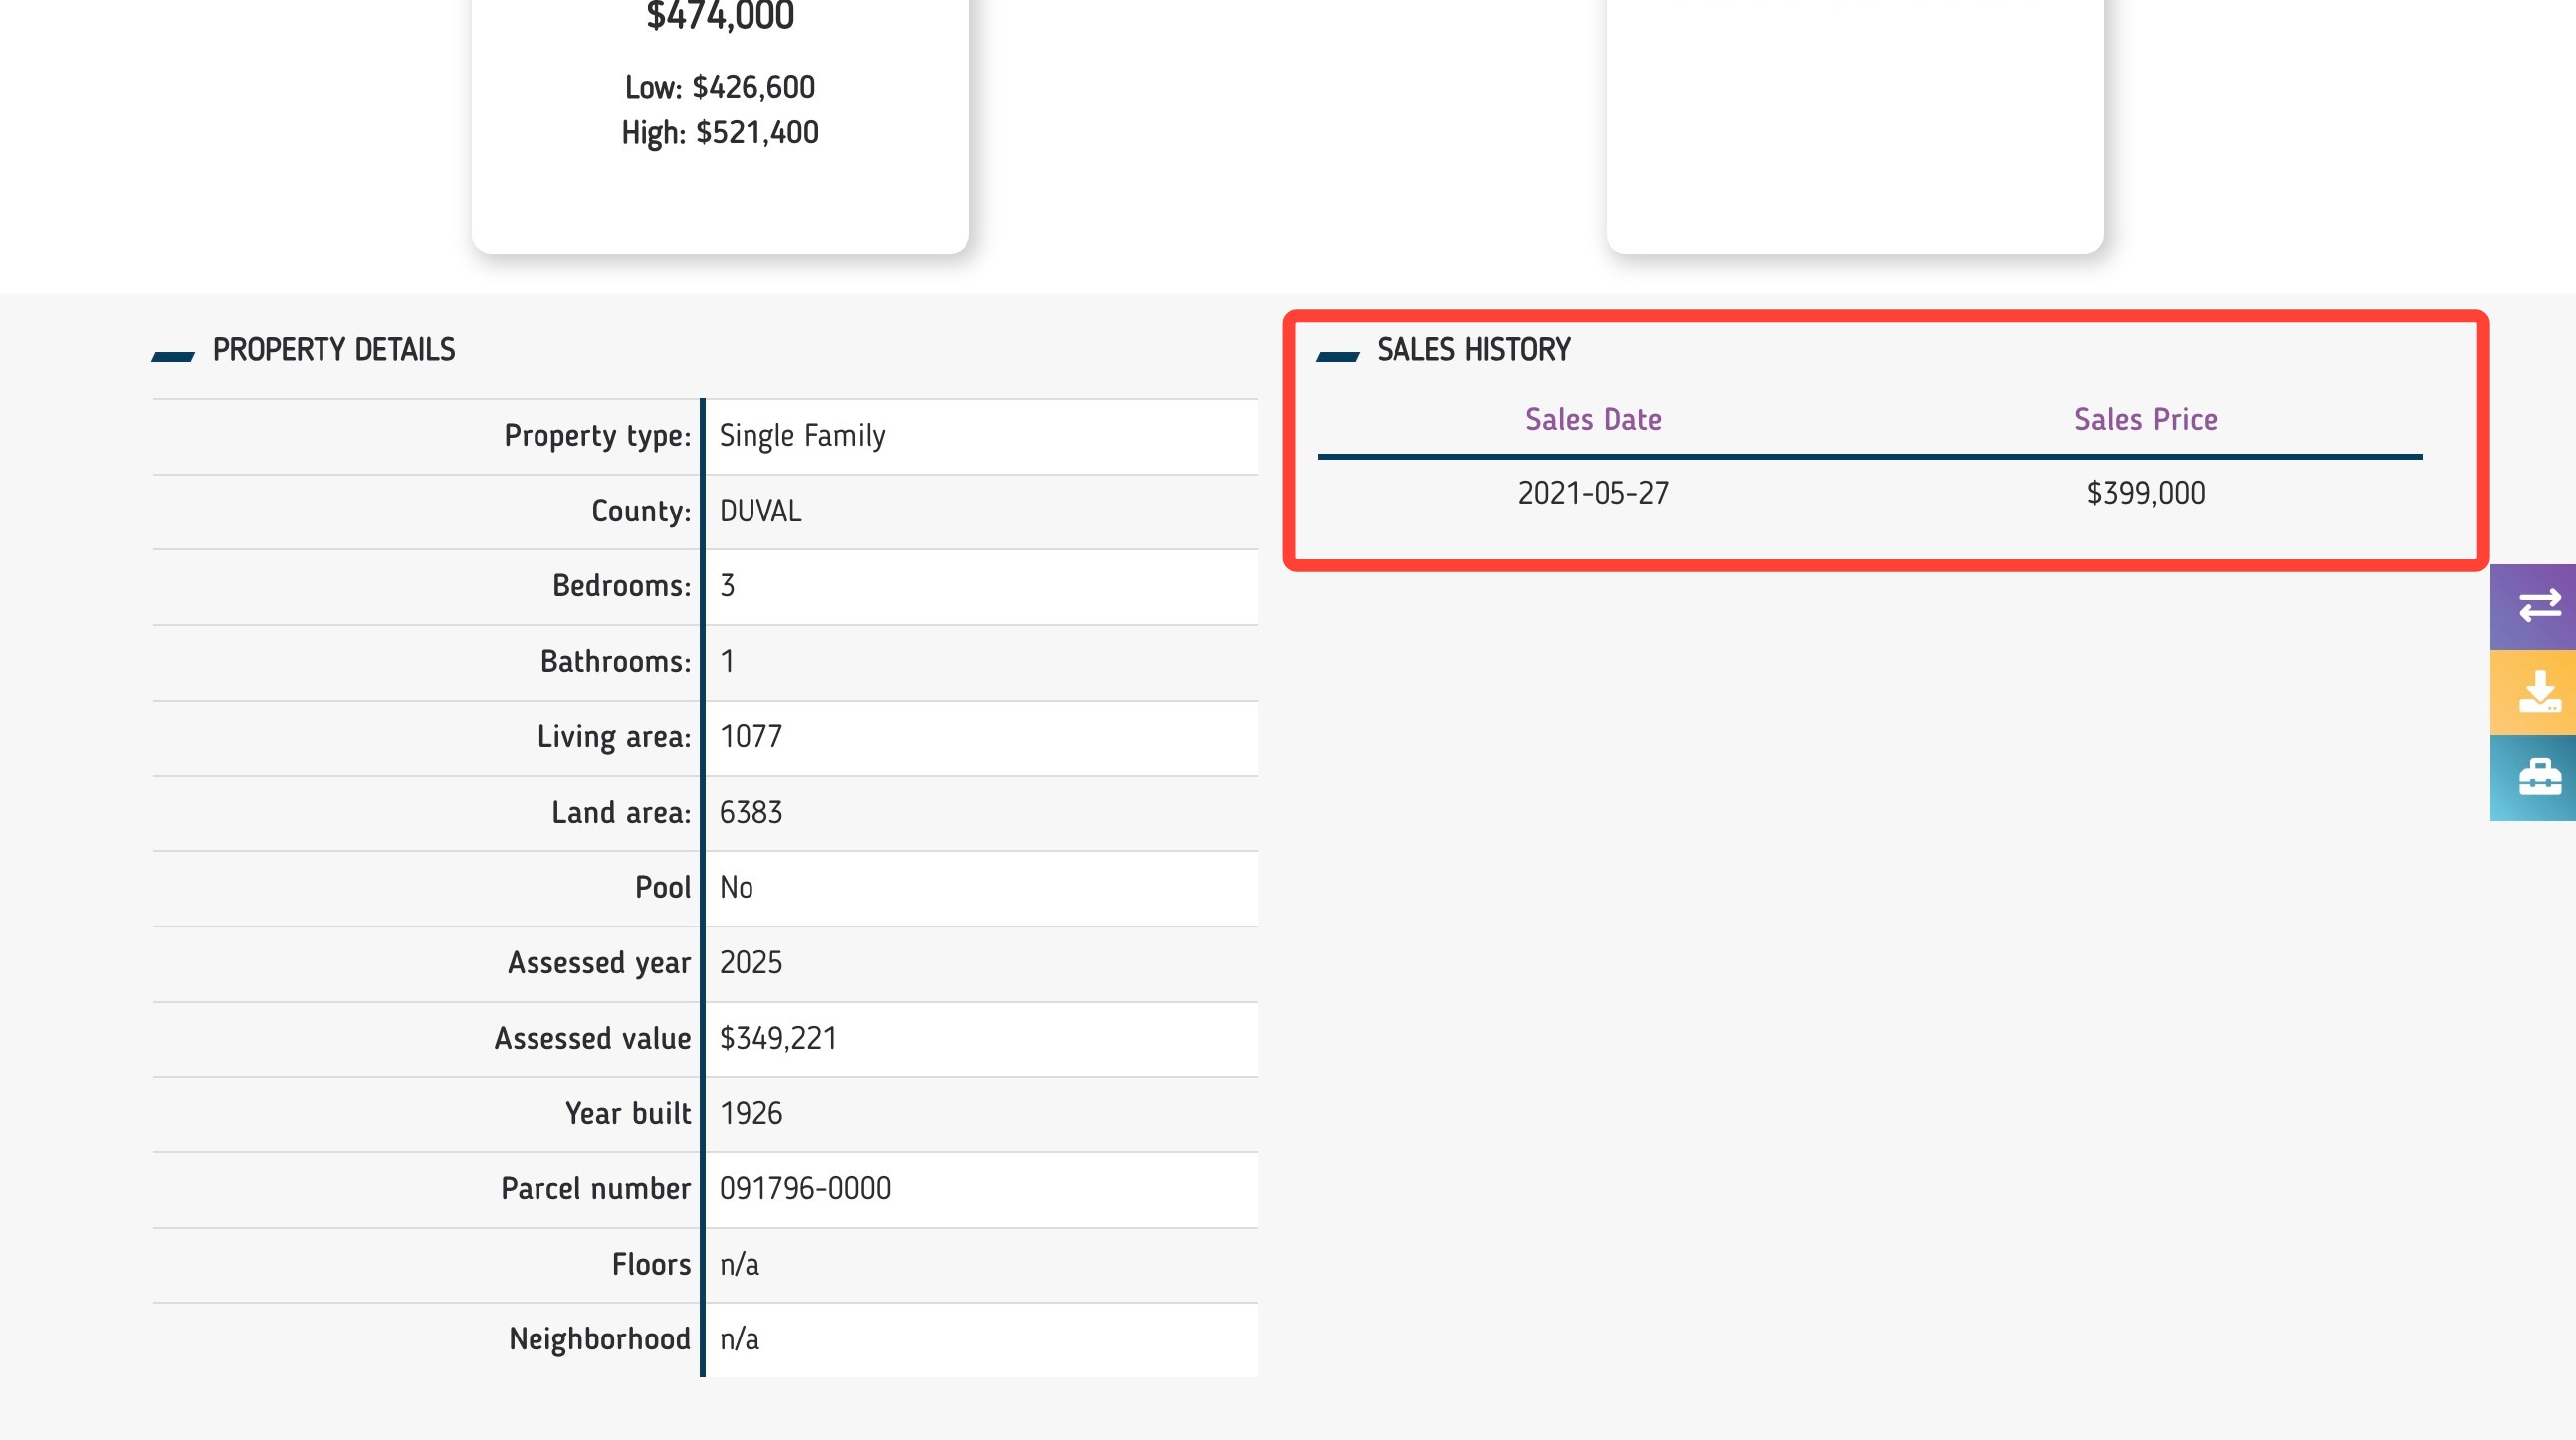
Property Details and Sales History
The property details table provides information about the home, such as the number of bedrooms, bathrooms, living area and estimated value.
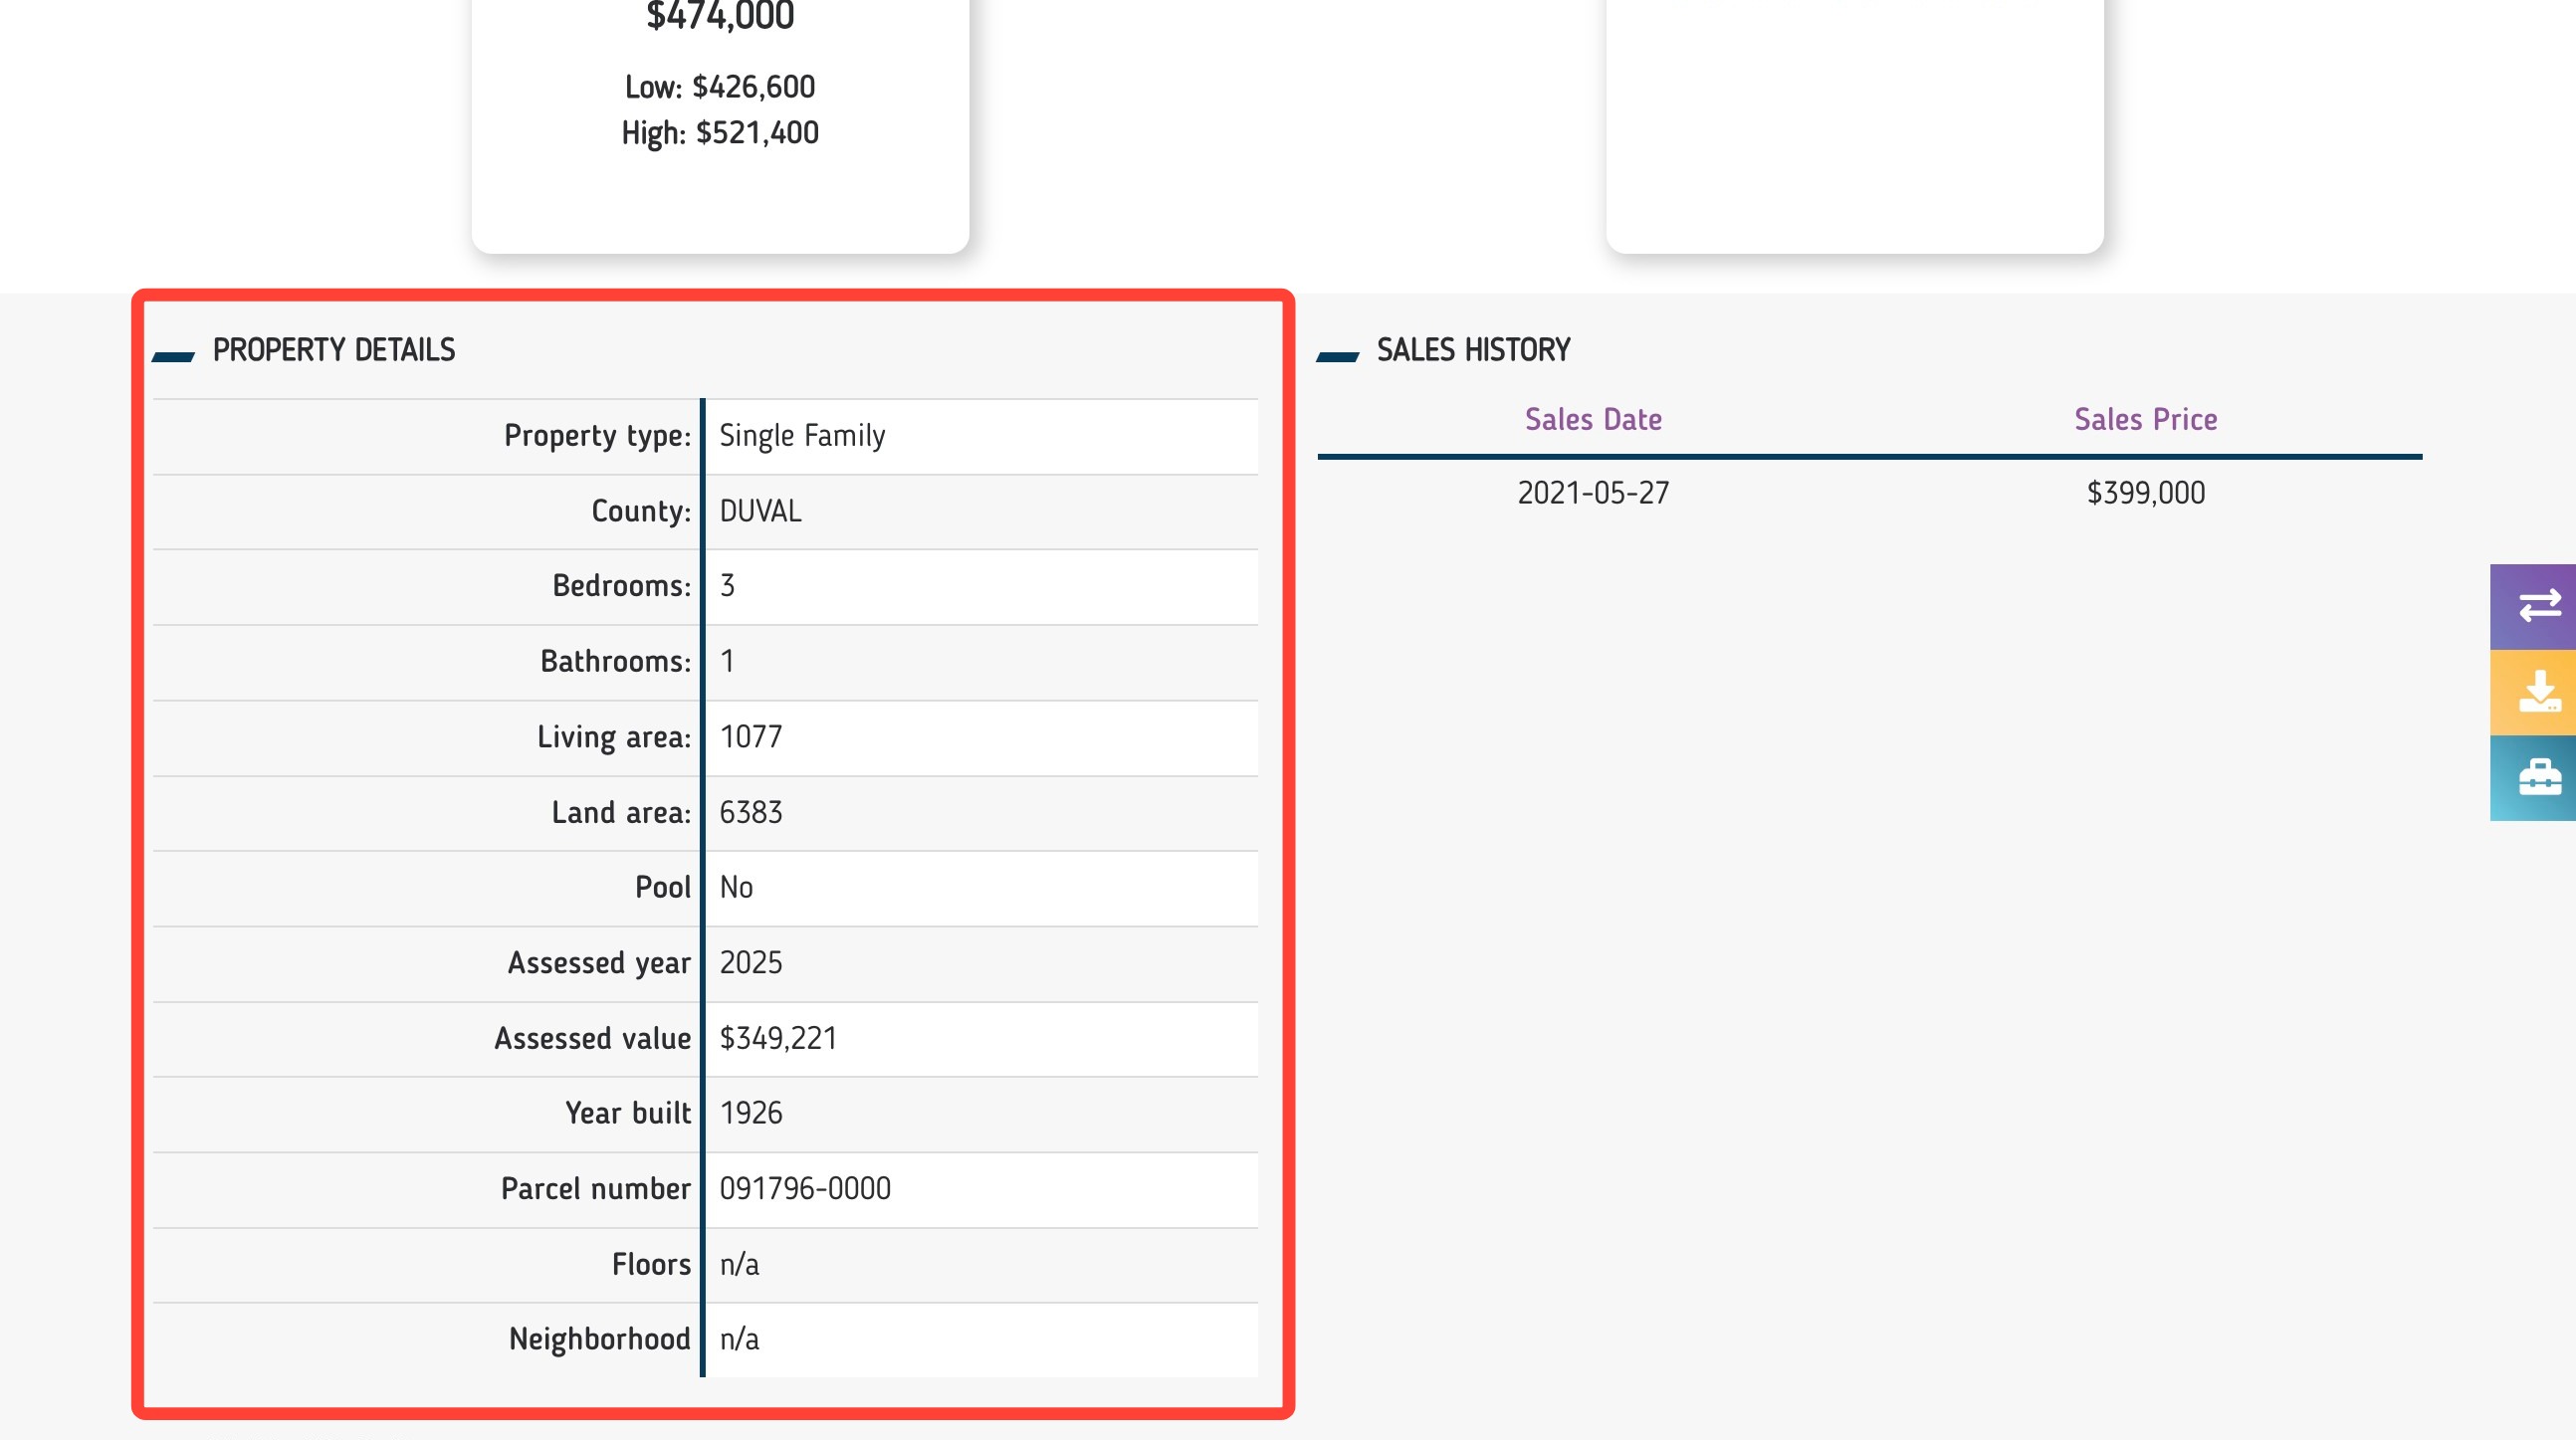
The Sales History table provides the the sales dates and prices for past sales of the home.
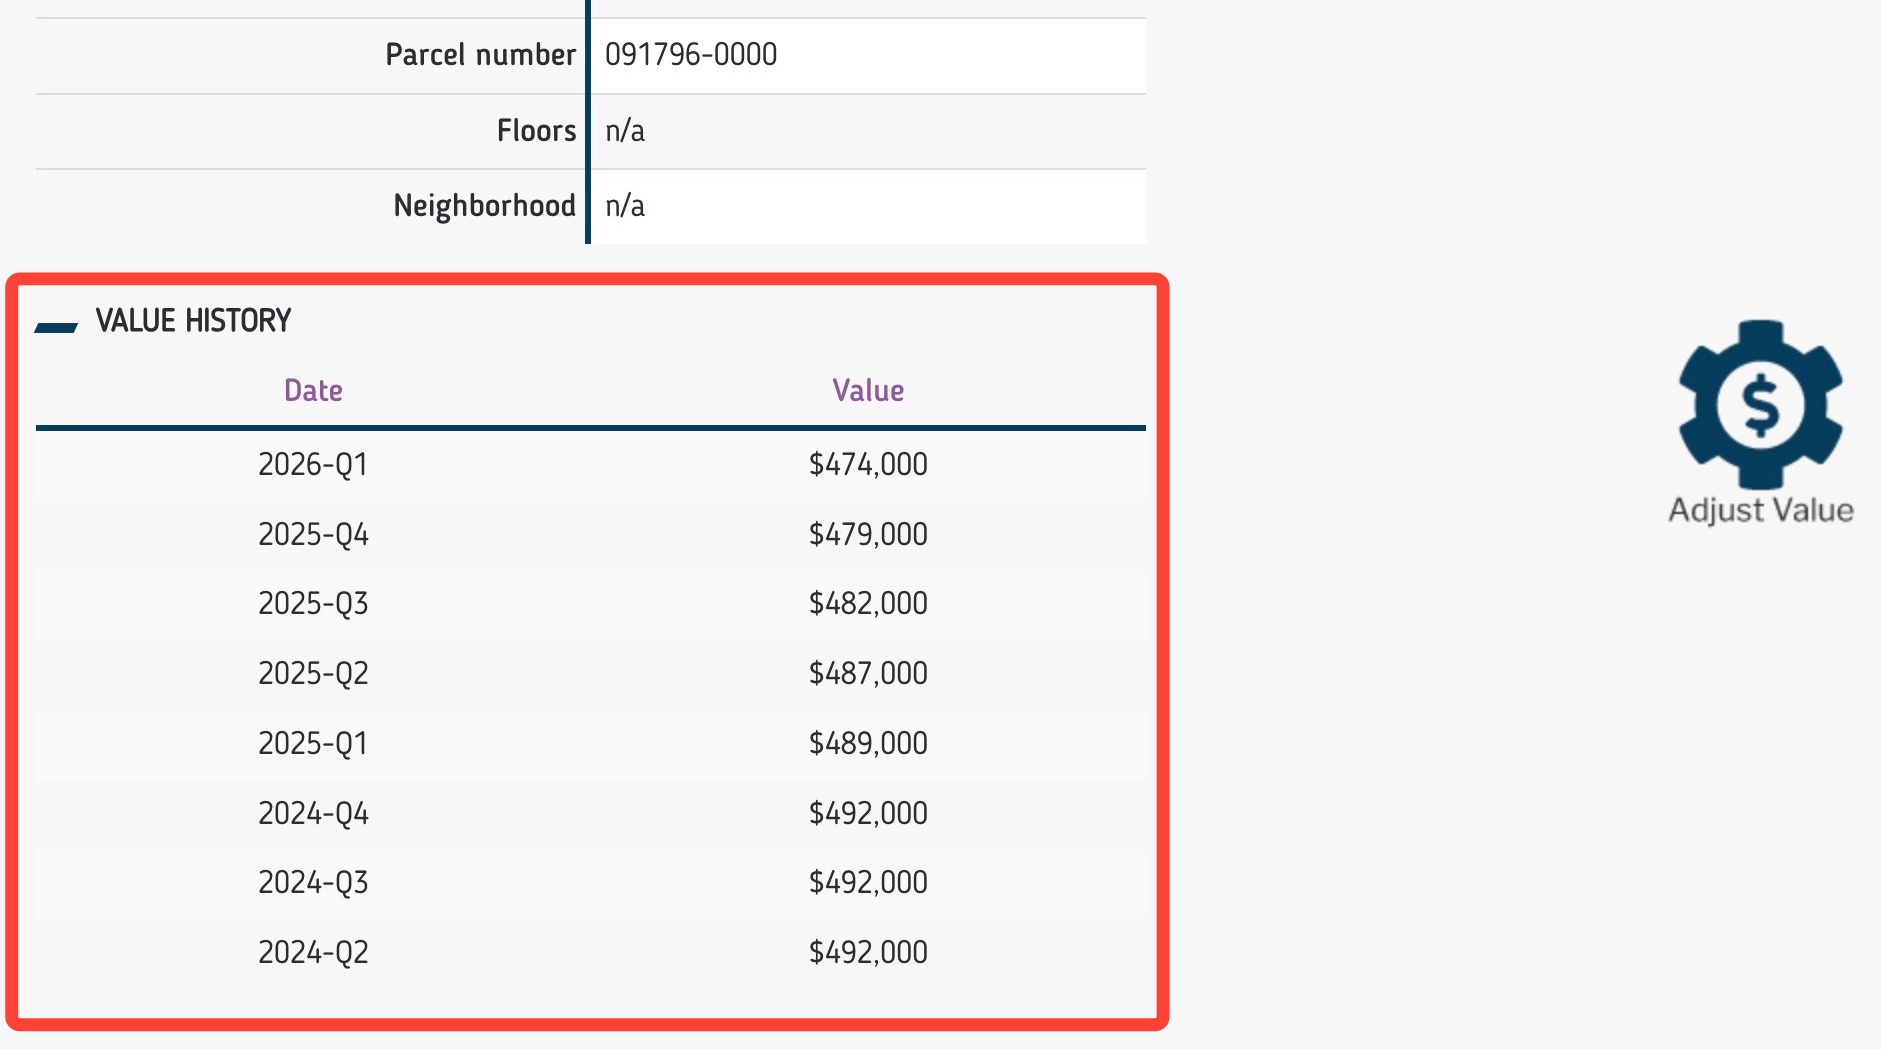
Value History
The value history table displays the average value of the home over the last eight quarters.
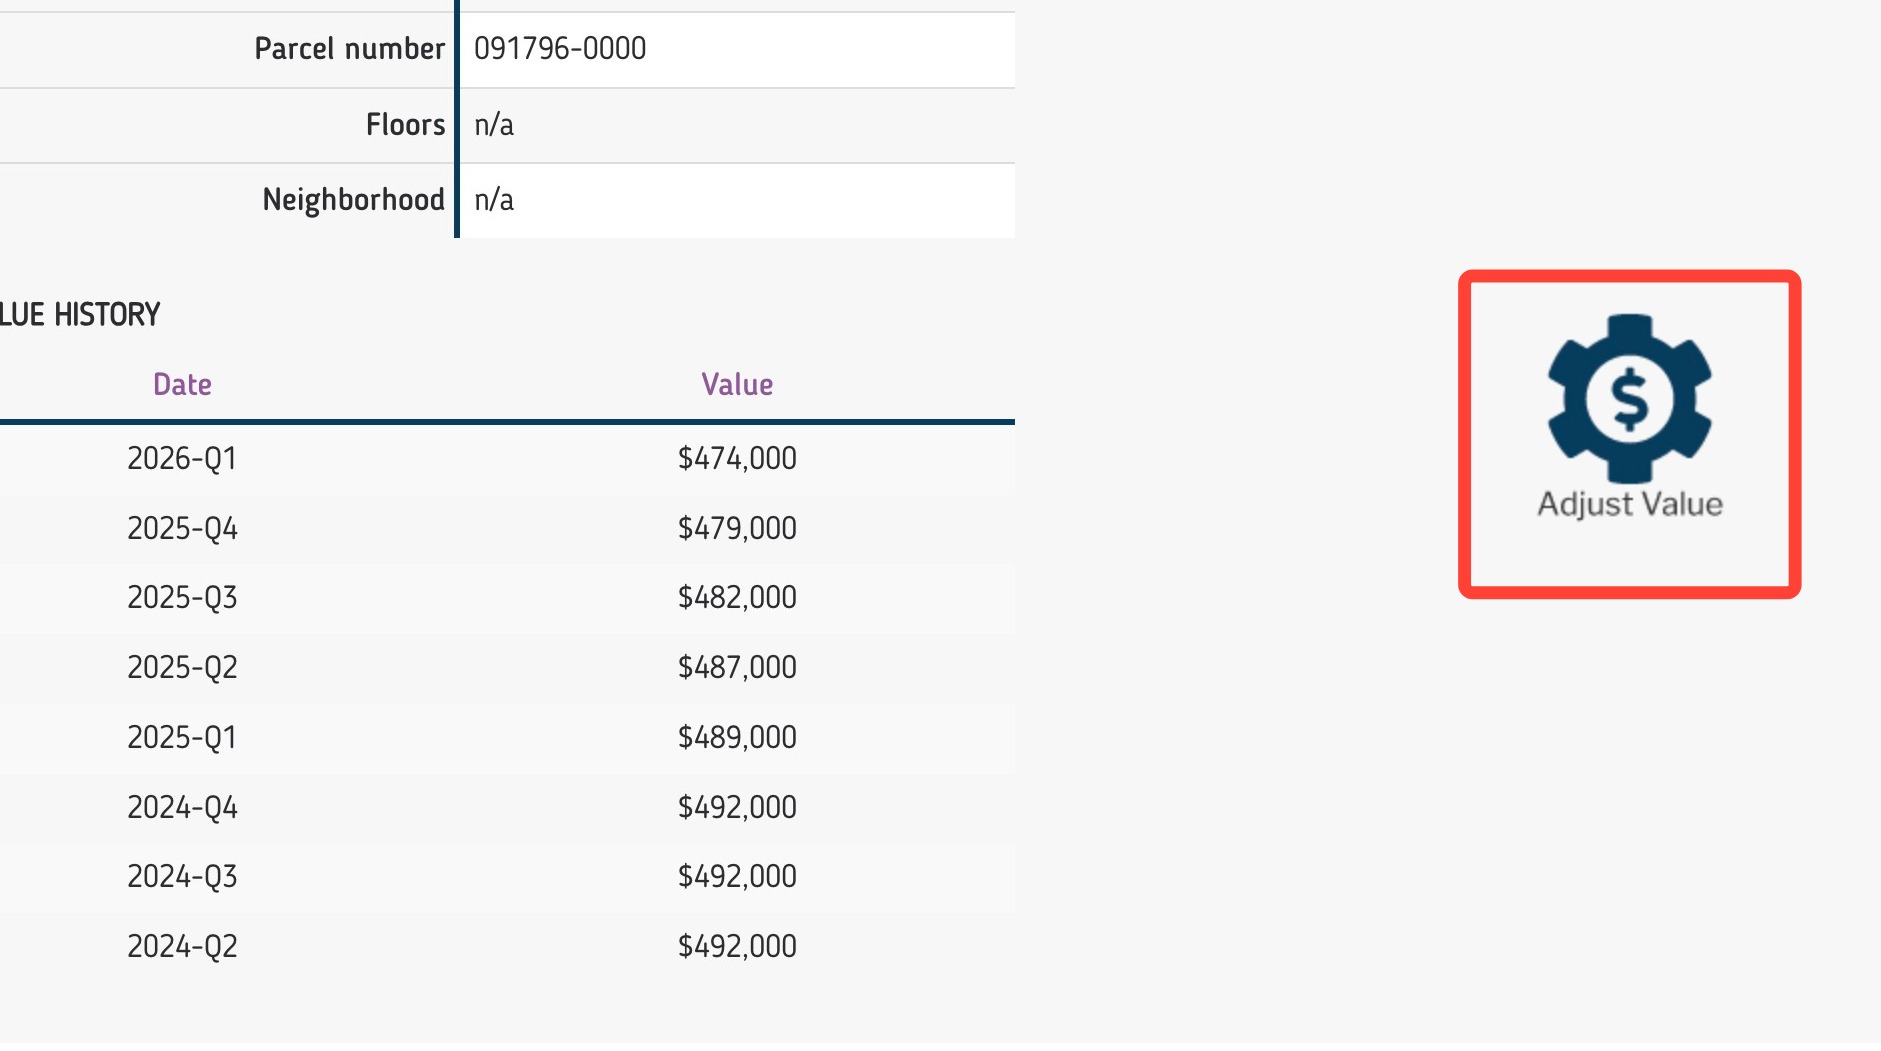
Adjusting Values
You can make adjustments to your value under three categories using the Adjust Value button:
- Property Details: The user may adjust all the values that appear in the Property Details. Adjustments in this section do not affect the valuation.
- Renovations, Upgrades and Other Adjustments: The user may enter up to three custom adjustments. Values will be added to the estimate to create an Adjusted Estimate.
- Public Record Adjustments: The user may adjust the Living Area. The tool will automatically create an Adjusted Estimate based on the new Living Area size.
When finished, click the Apply Adjustment button. The Adjusted Estimate will revise based on your adjustment.
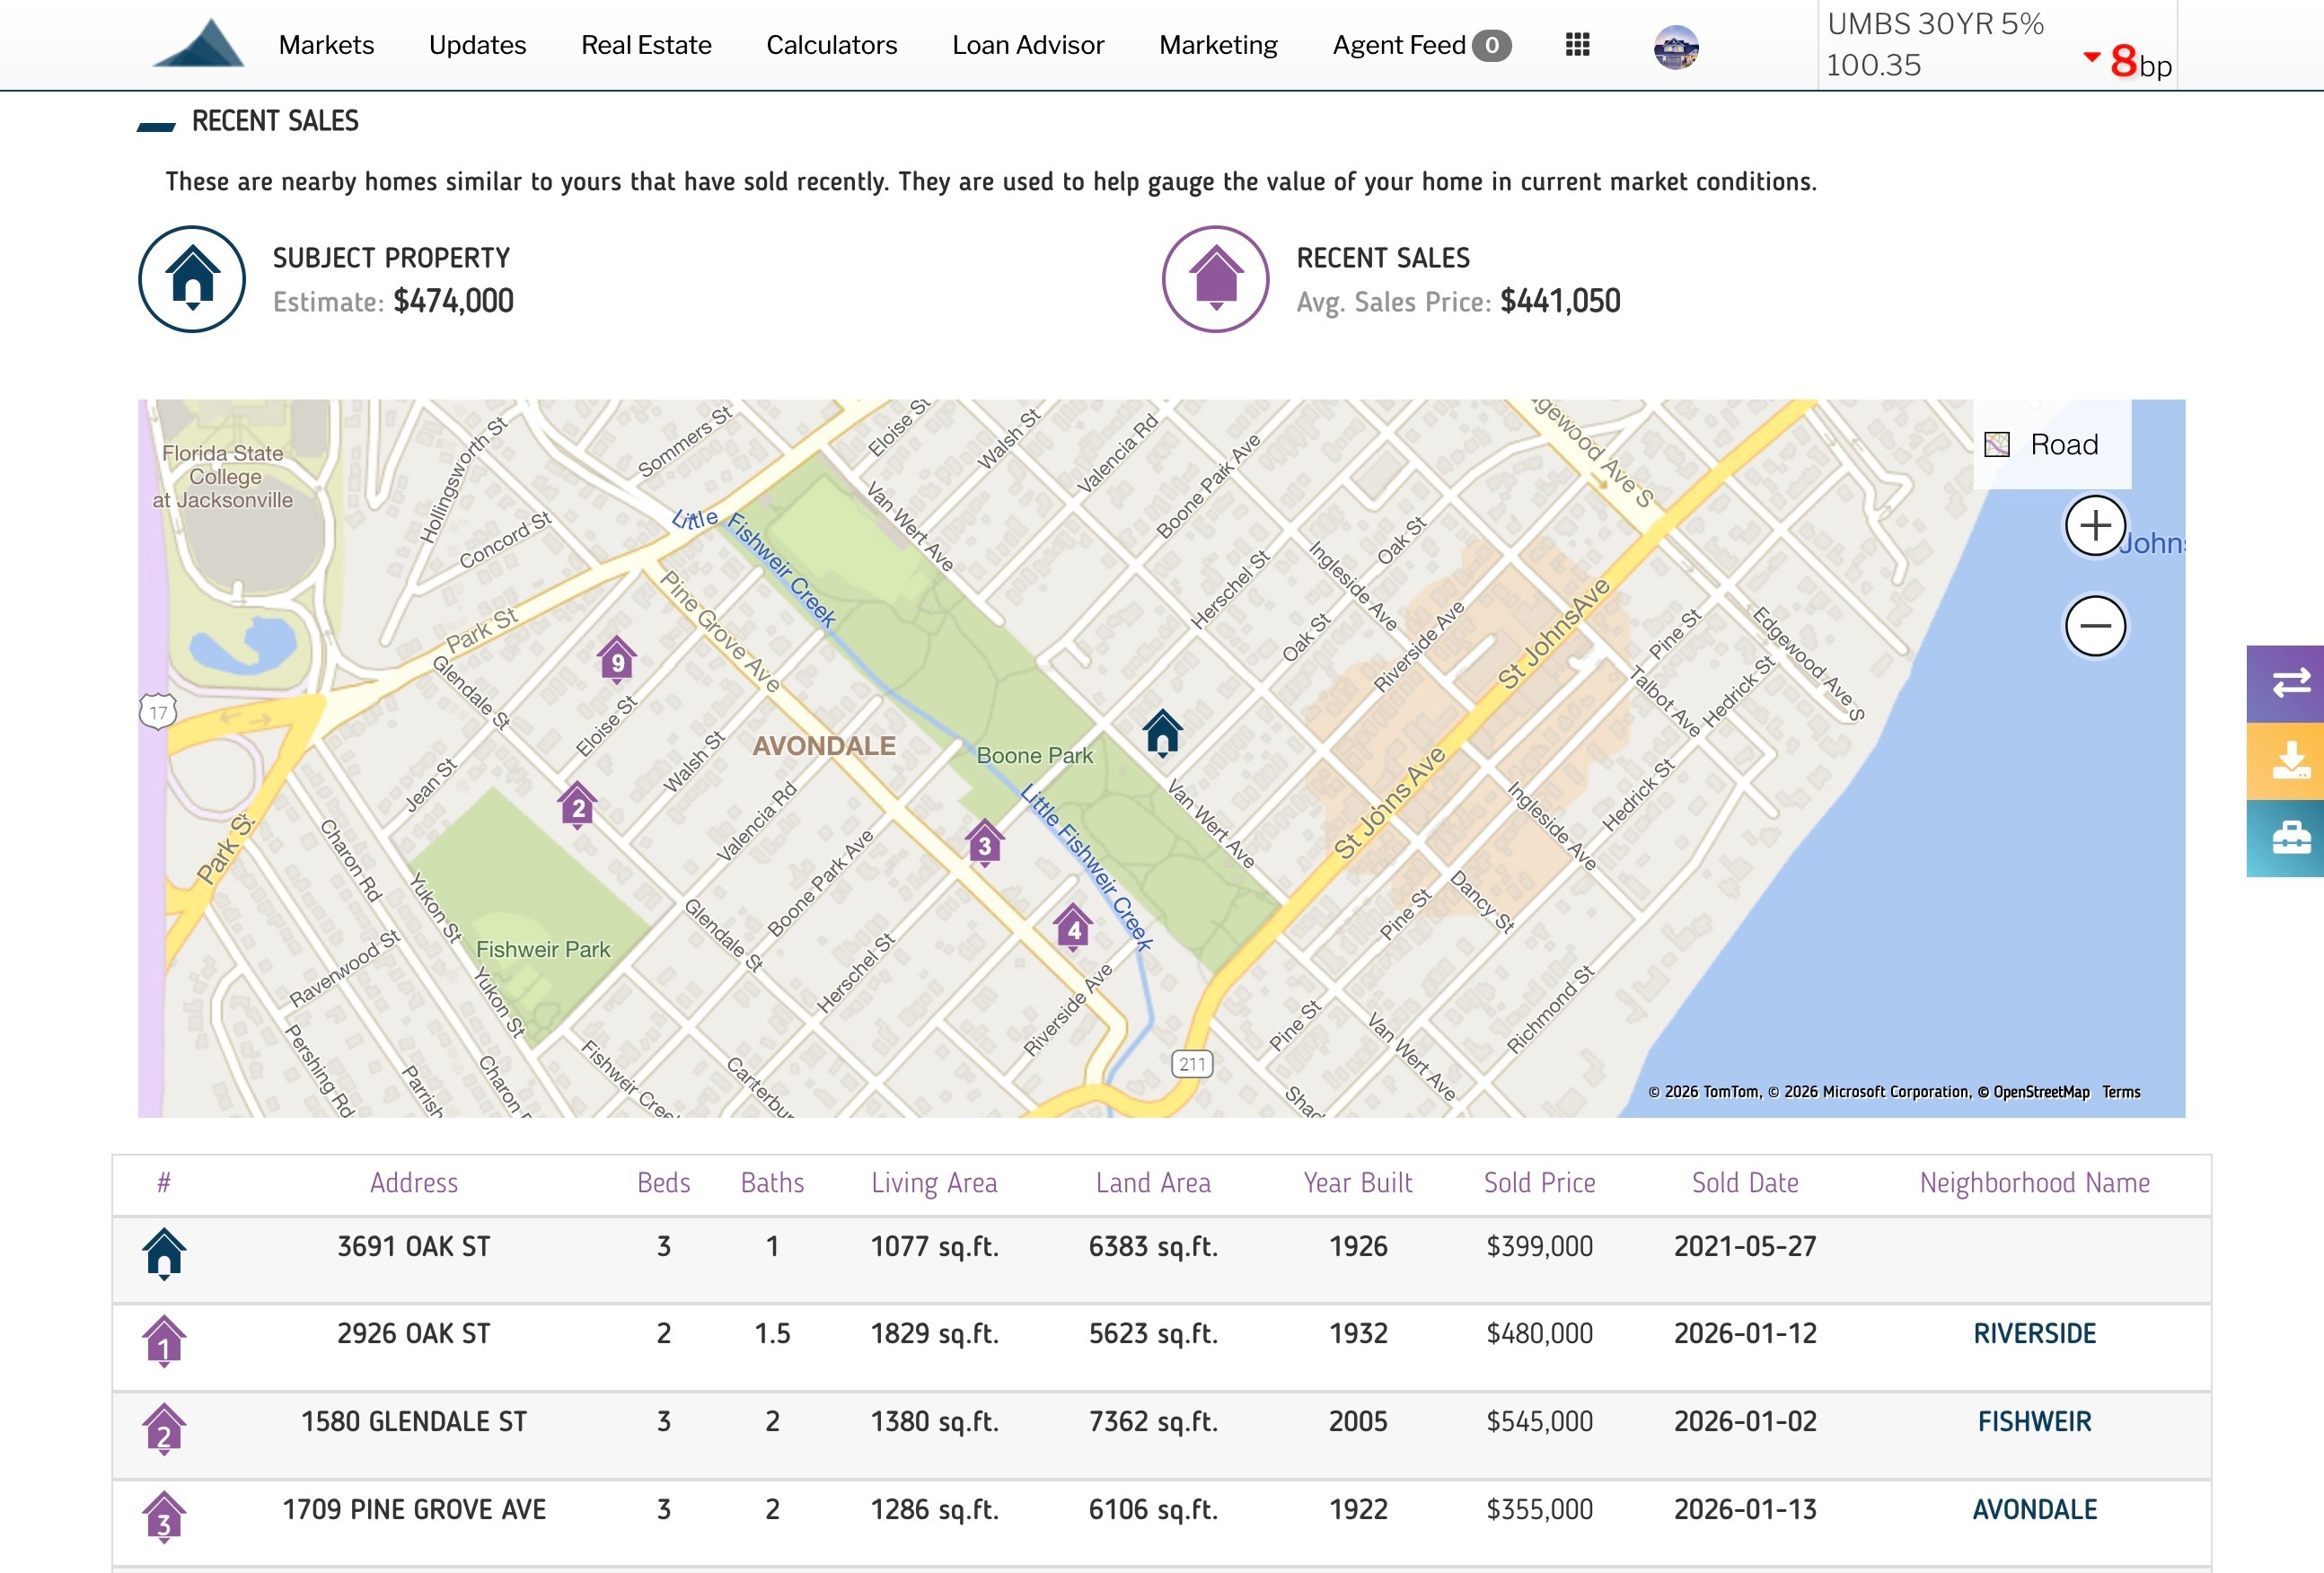
Recent Sales
Recent Sales section provides a current estimate of the subject home along with an average sales price based on recent sales.
Below, you will find a map and its corresponding table which will display up to ten different comps in the area with specific details for each property as well as the price each home was last sold for.
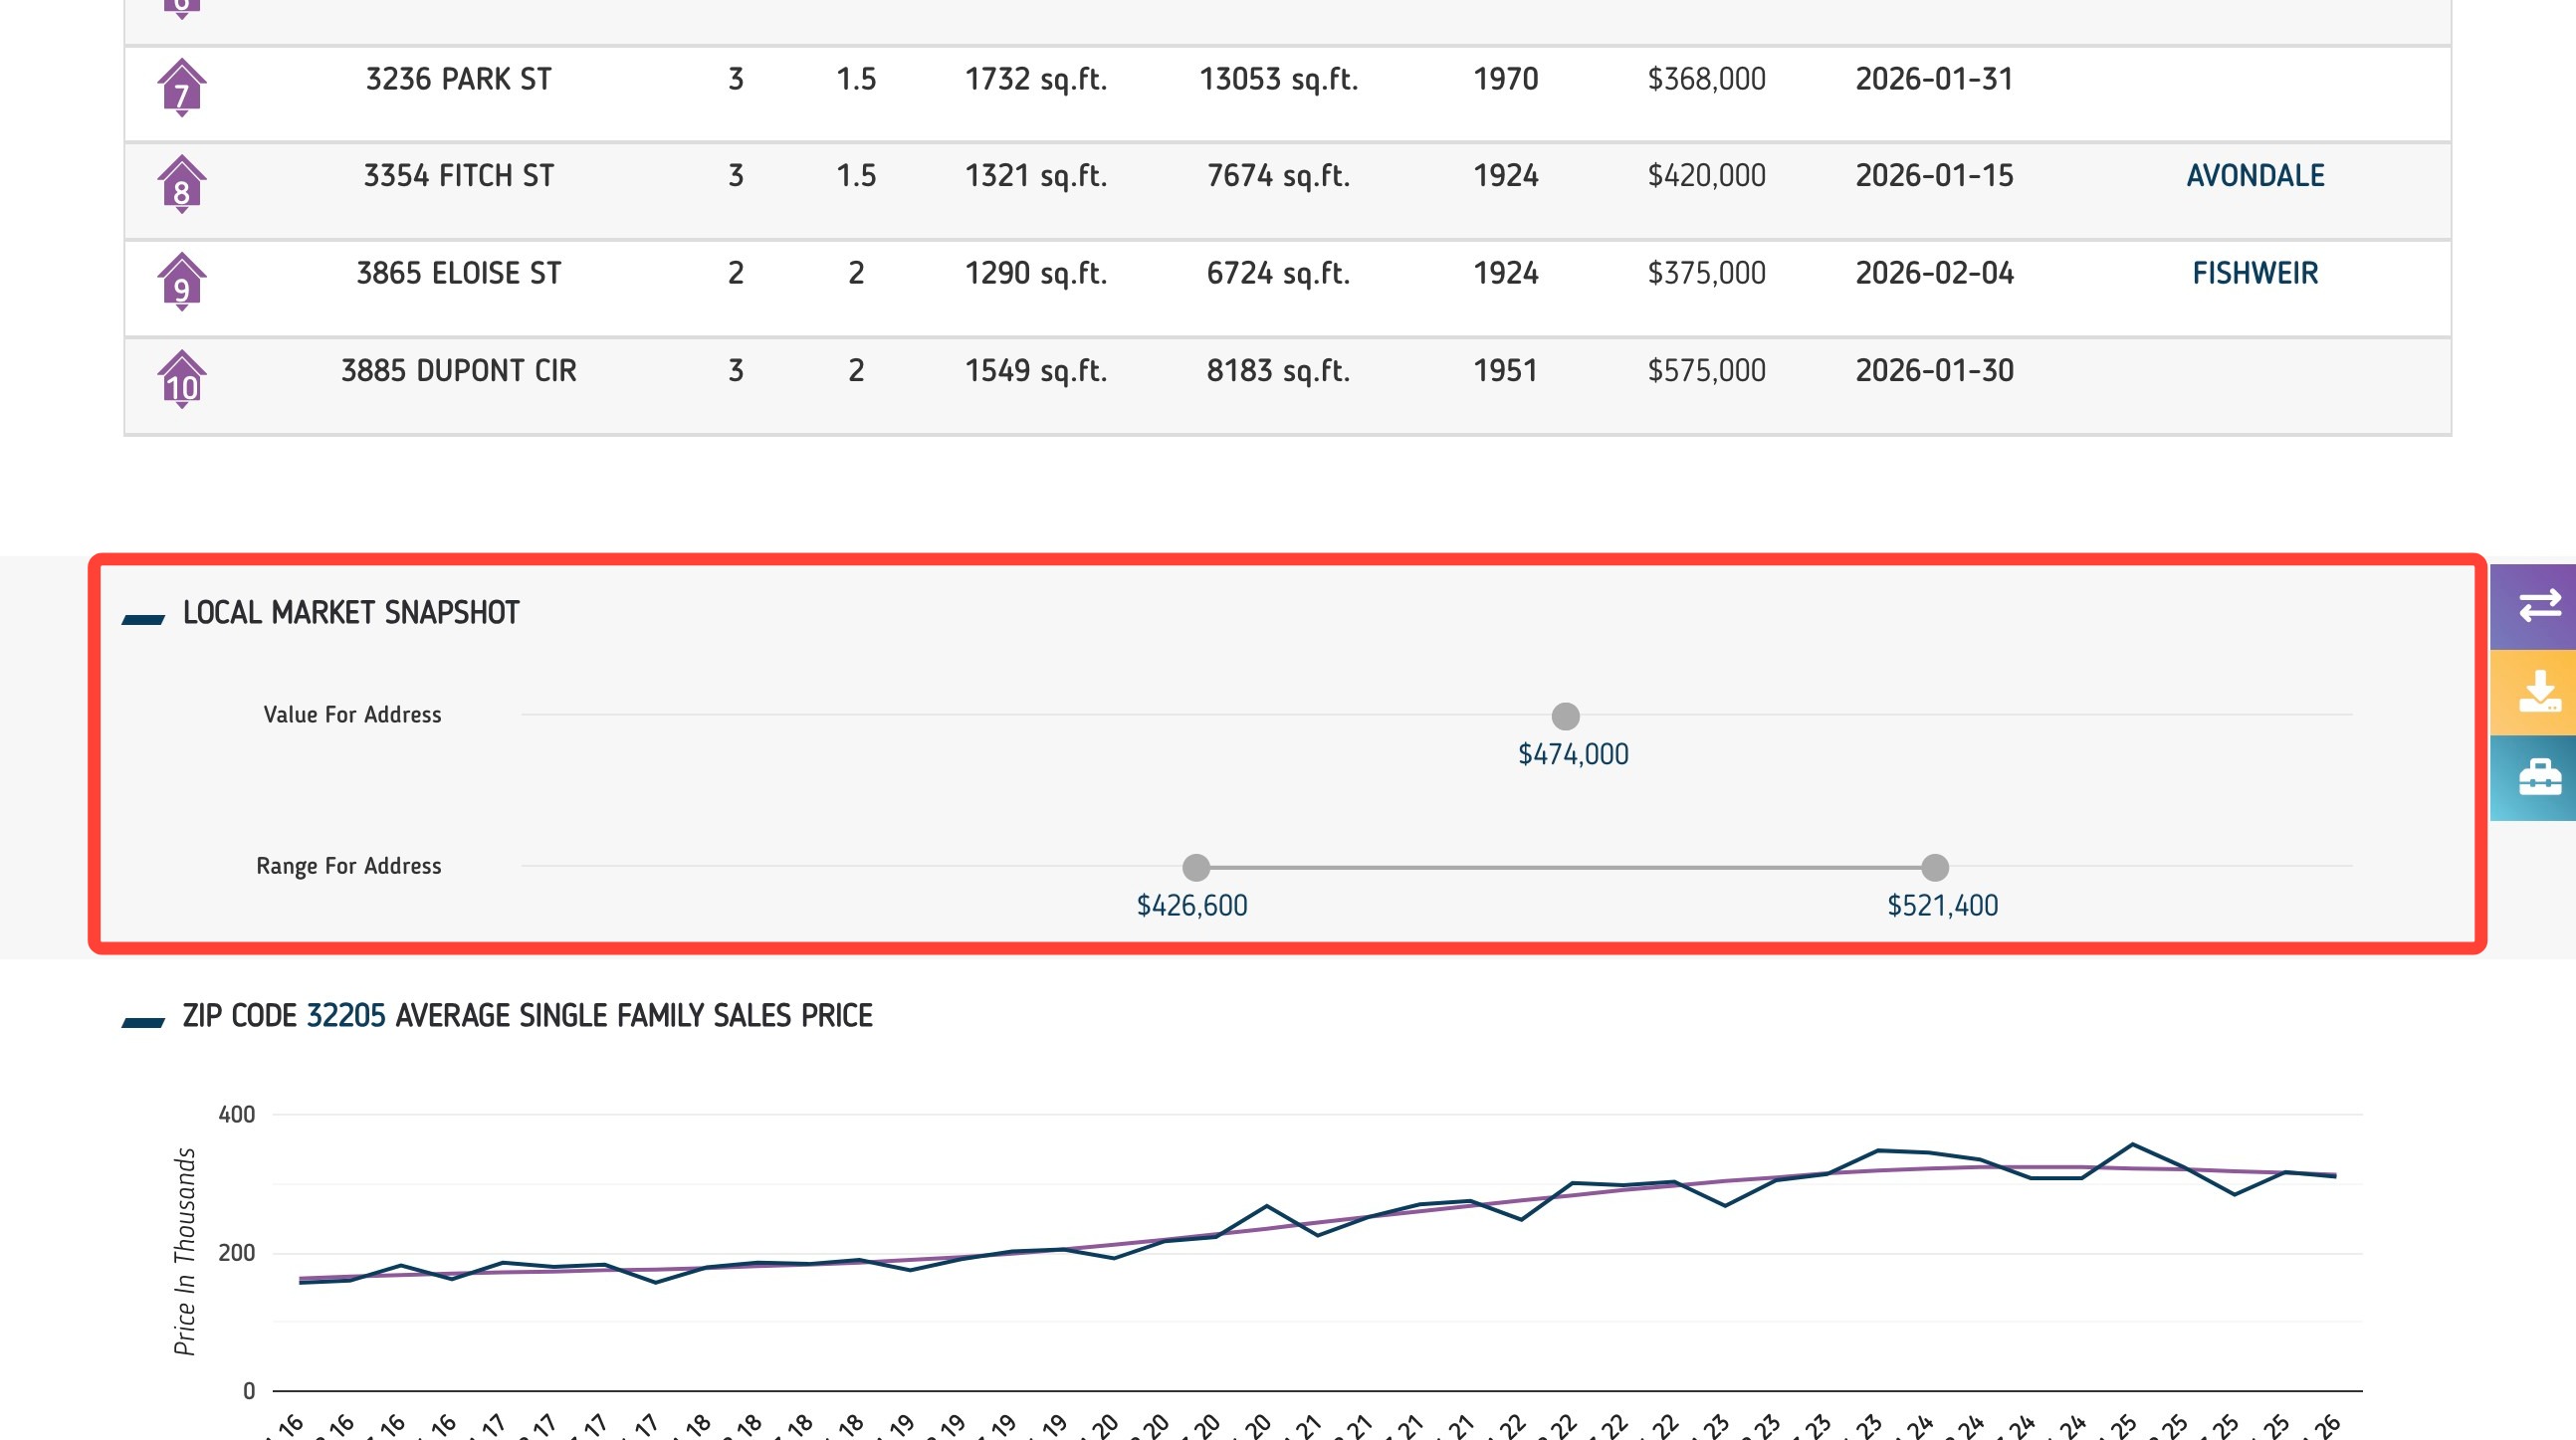
Local Market Snapshot
The Local Market Snapshot shows the current value of the home and a price range for the address.
Neighborhood Home Value and Market Trends
These charts show how the local housing market has performed over time, including:
Average single-family home price
Average price per square foot
Number of homes sold
Each chart is broken down by quarter, allowing you to review trends and explain how home values and market activity have changed in the neighborhood.
Related to