Summary
The Loan Comparison report gives you a comprehensive, side-by-side view of multiple loan scenarios so you can walk your client through their options with clarity and confidence. The report is now a single scrollable page organized into three main sections: Loan Rankings, the Financial Snapshot, and the Detailed Comparison.
Report Header
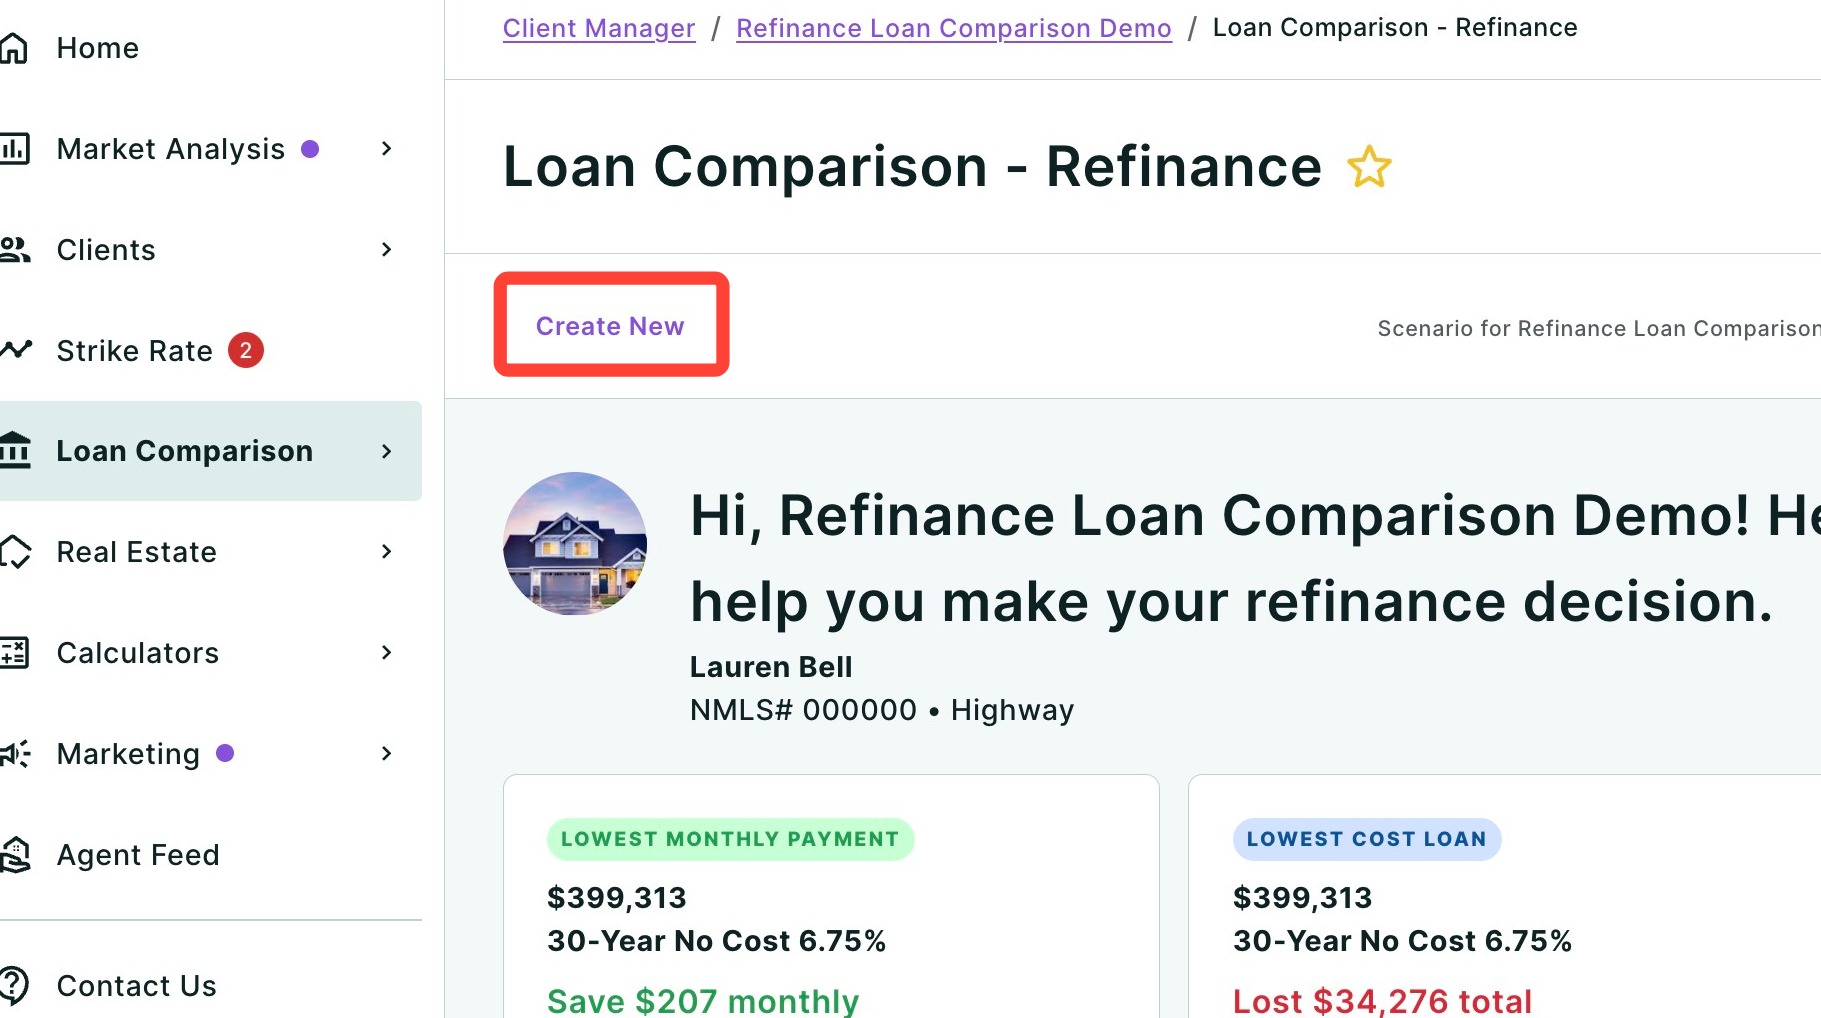
At the top of the report, your client will see a personalized greeting that includes your name, NMLS number, and company. A property image is also displayed alongside the greeting to give the report a polished, professional feel.
Above the report content, you will find three action buttons:
- Create New — Start a new Loan Comparison scenario from scratch.
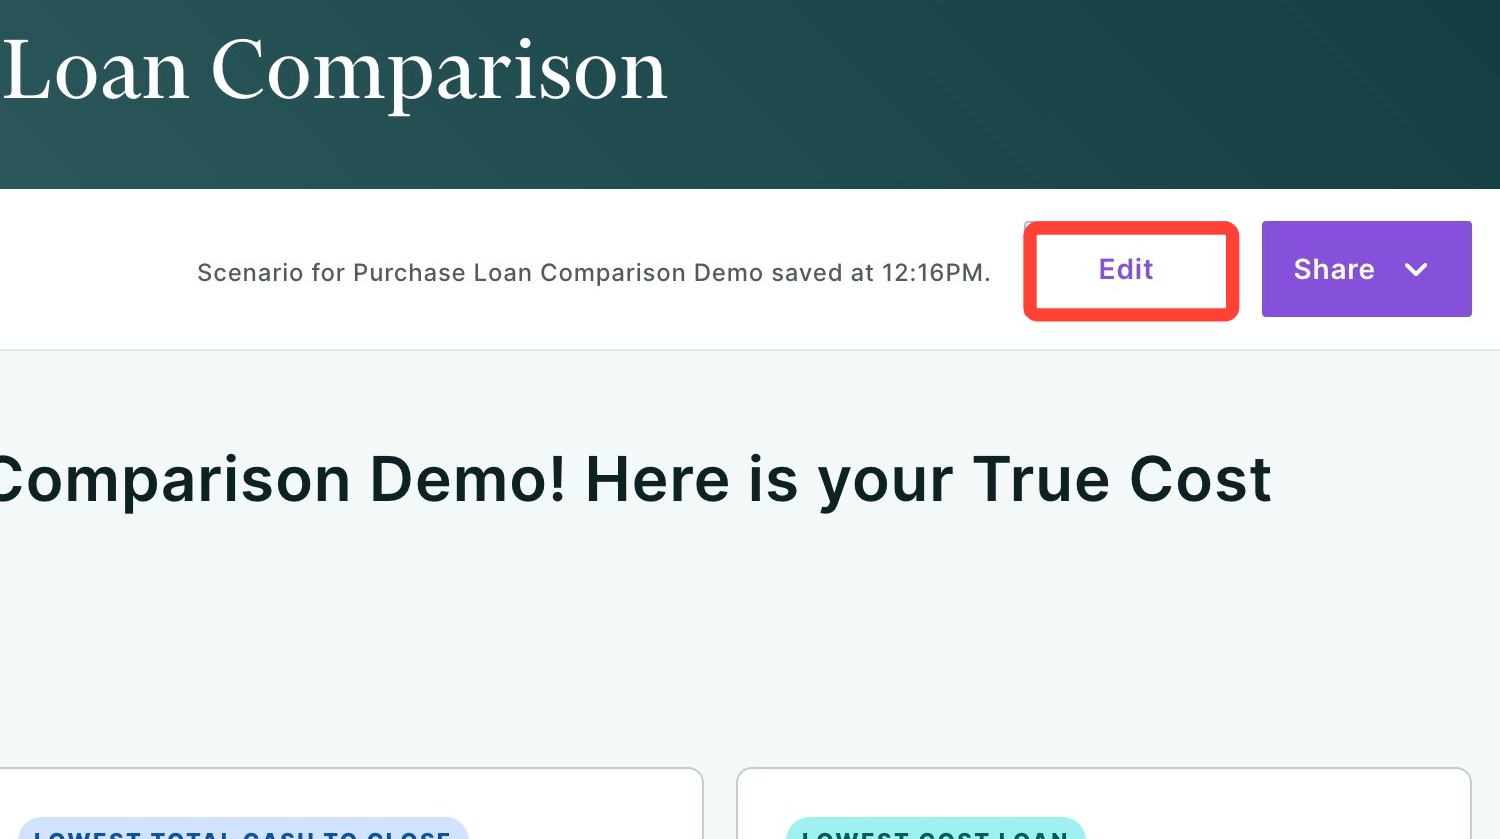
- Edit — Return to the input screen to modify the loan details for the current scenario.
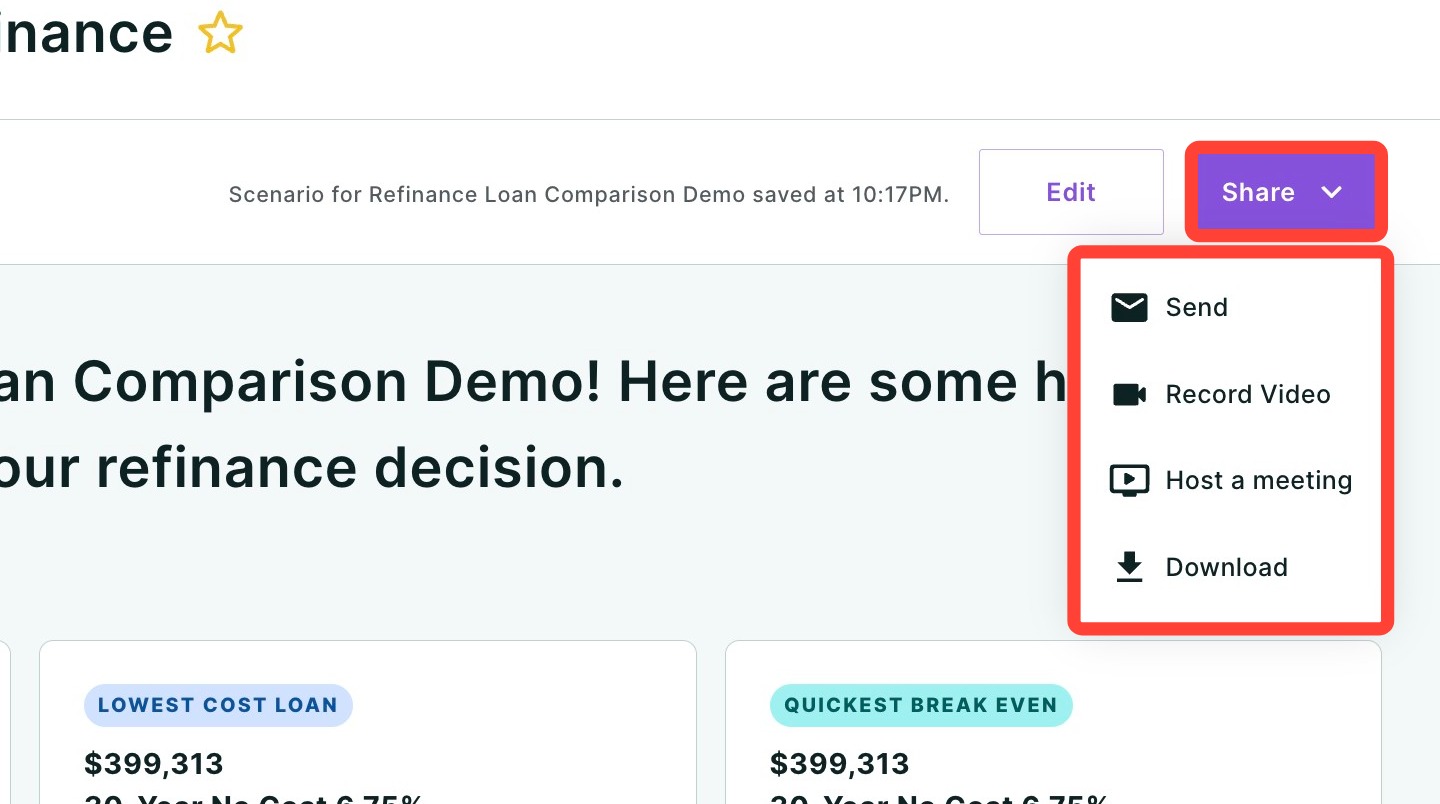
- Share — Open the sharing options to send the report to your client via email, link, or other methods. Click the dropdown arrow to see all available sharing formats. Click here to learn more about sharing.
Loan Rankings
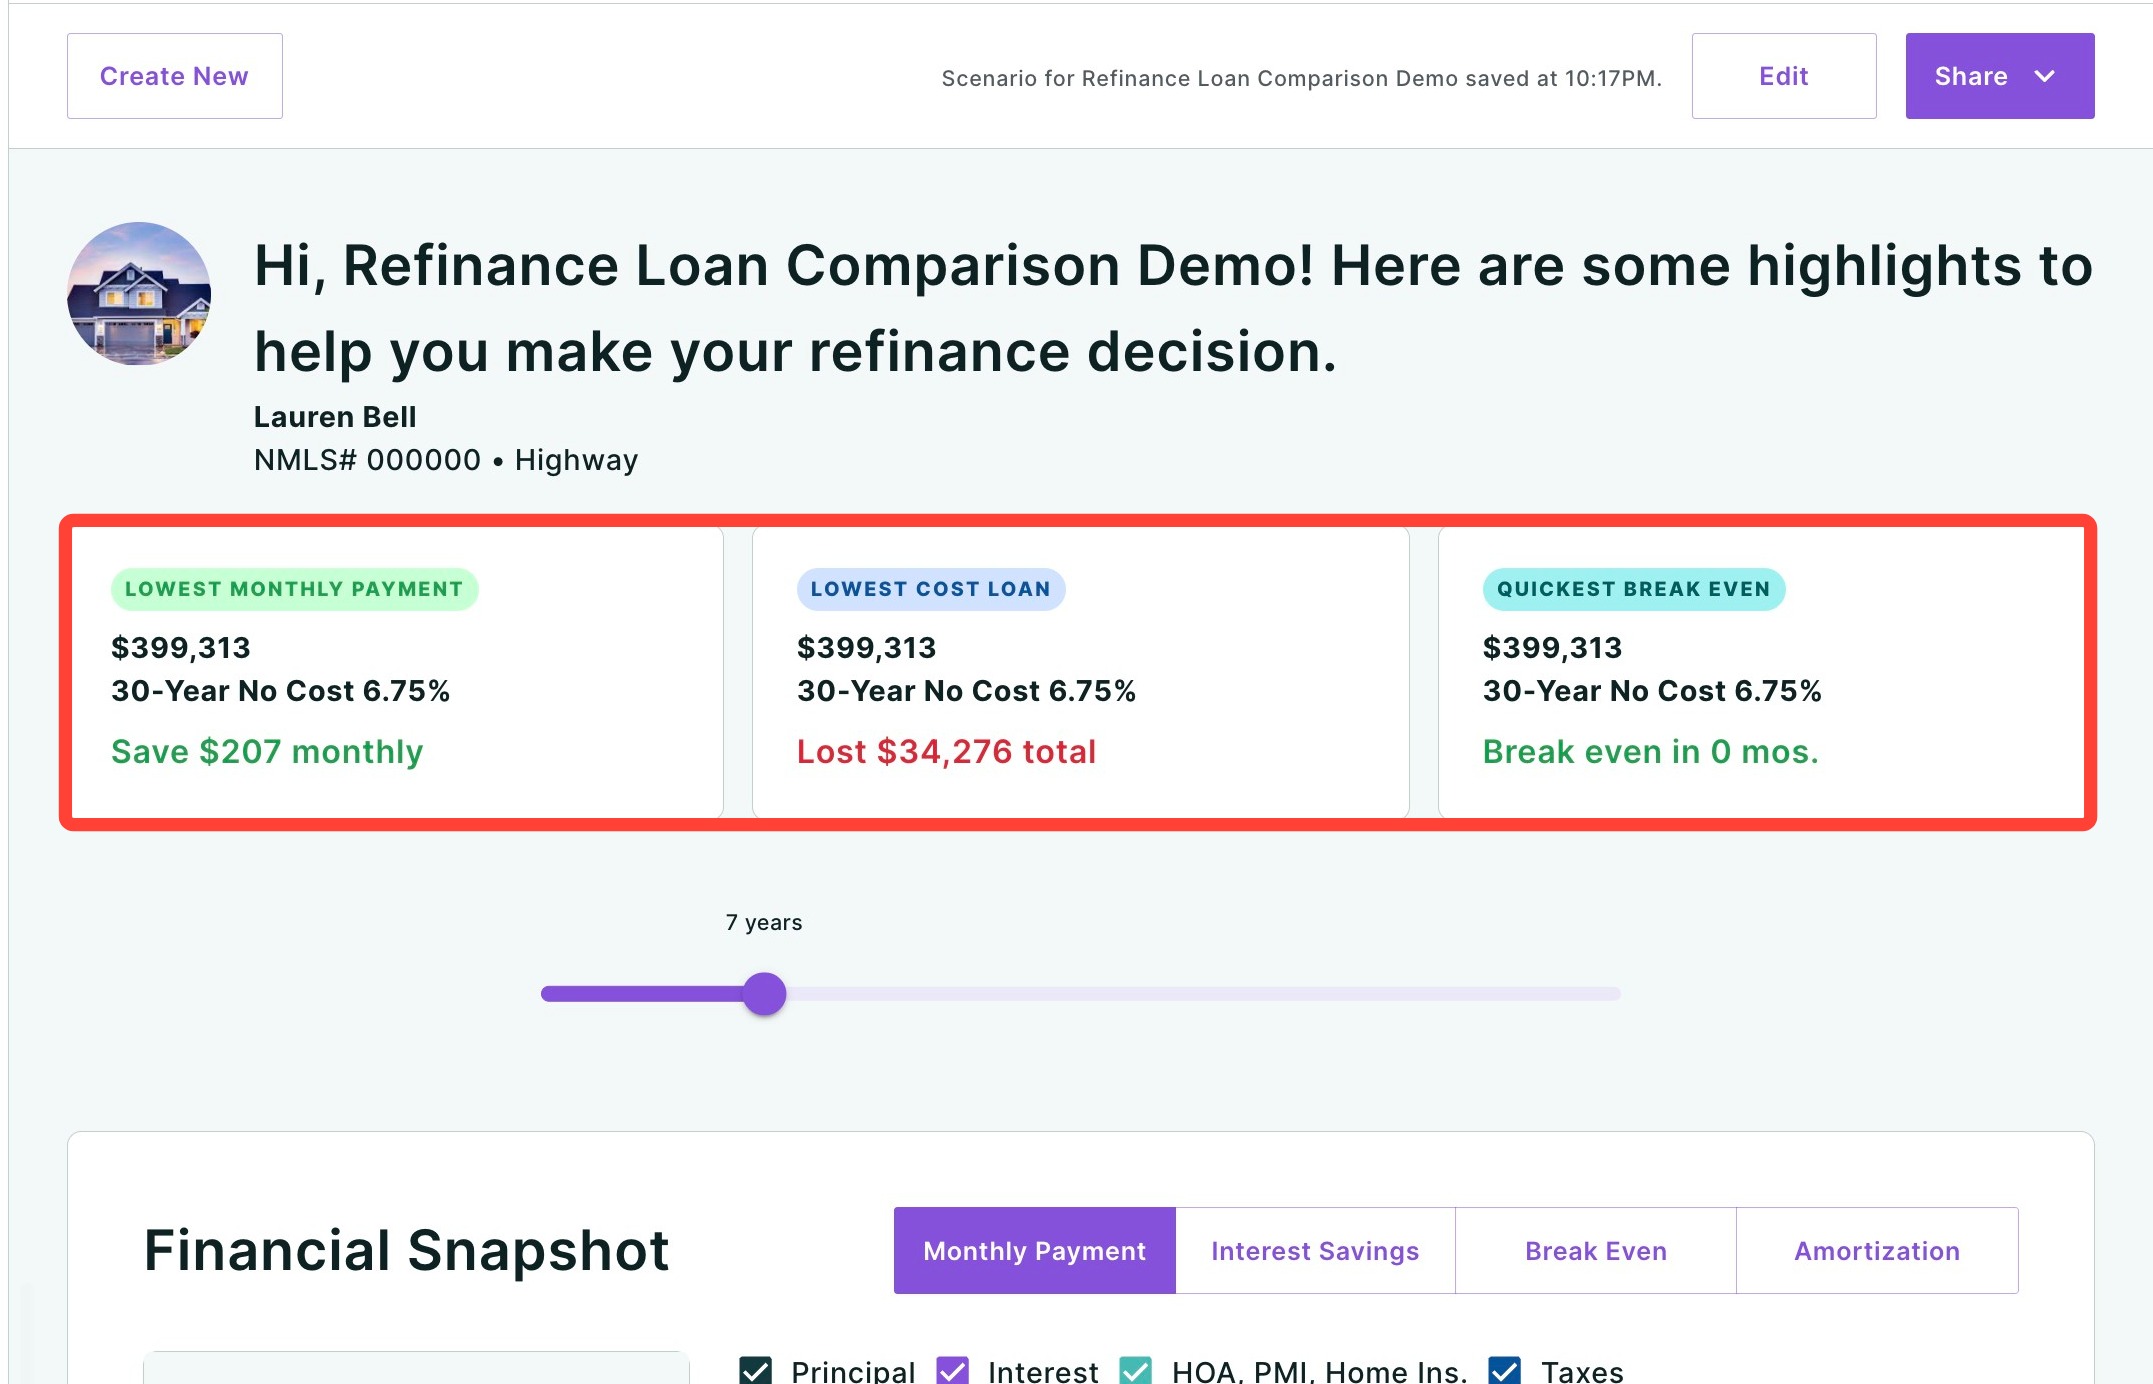
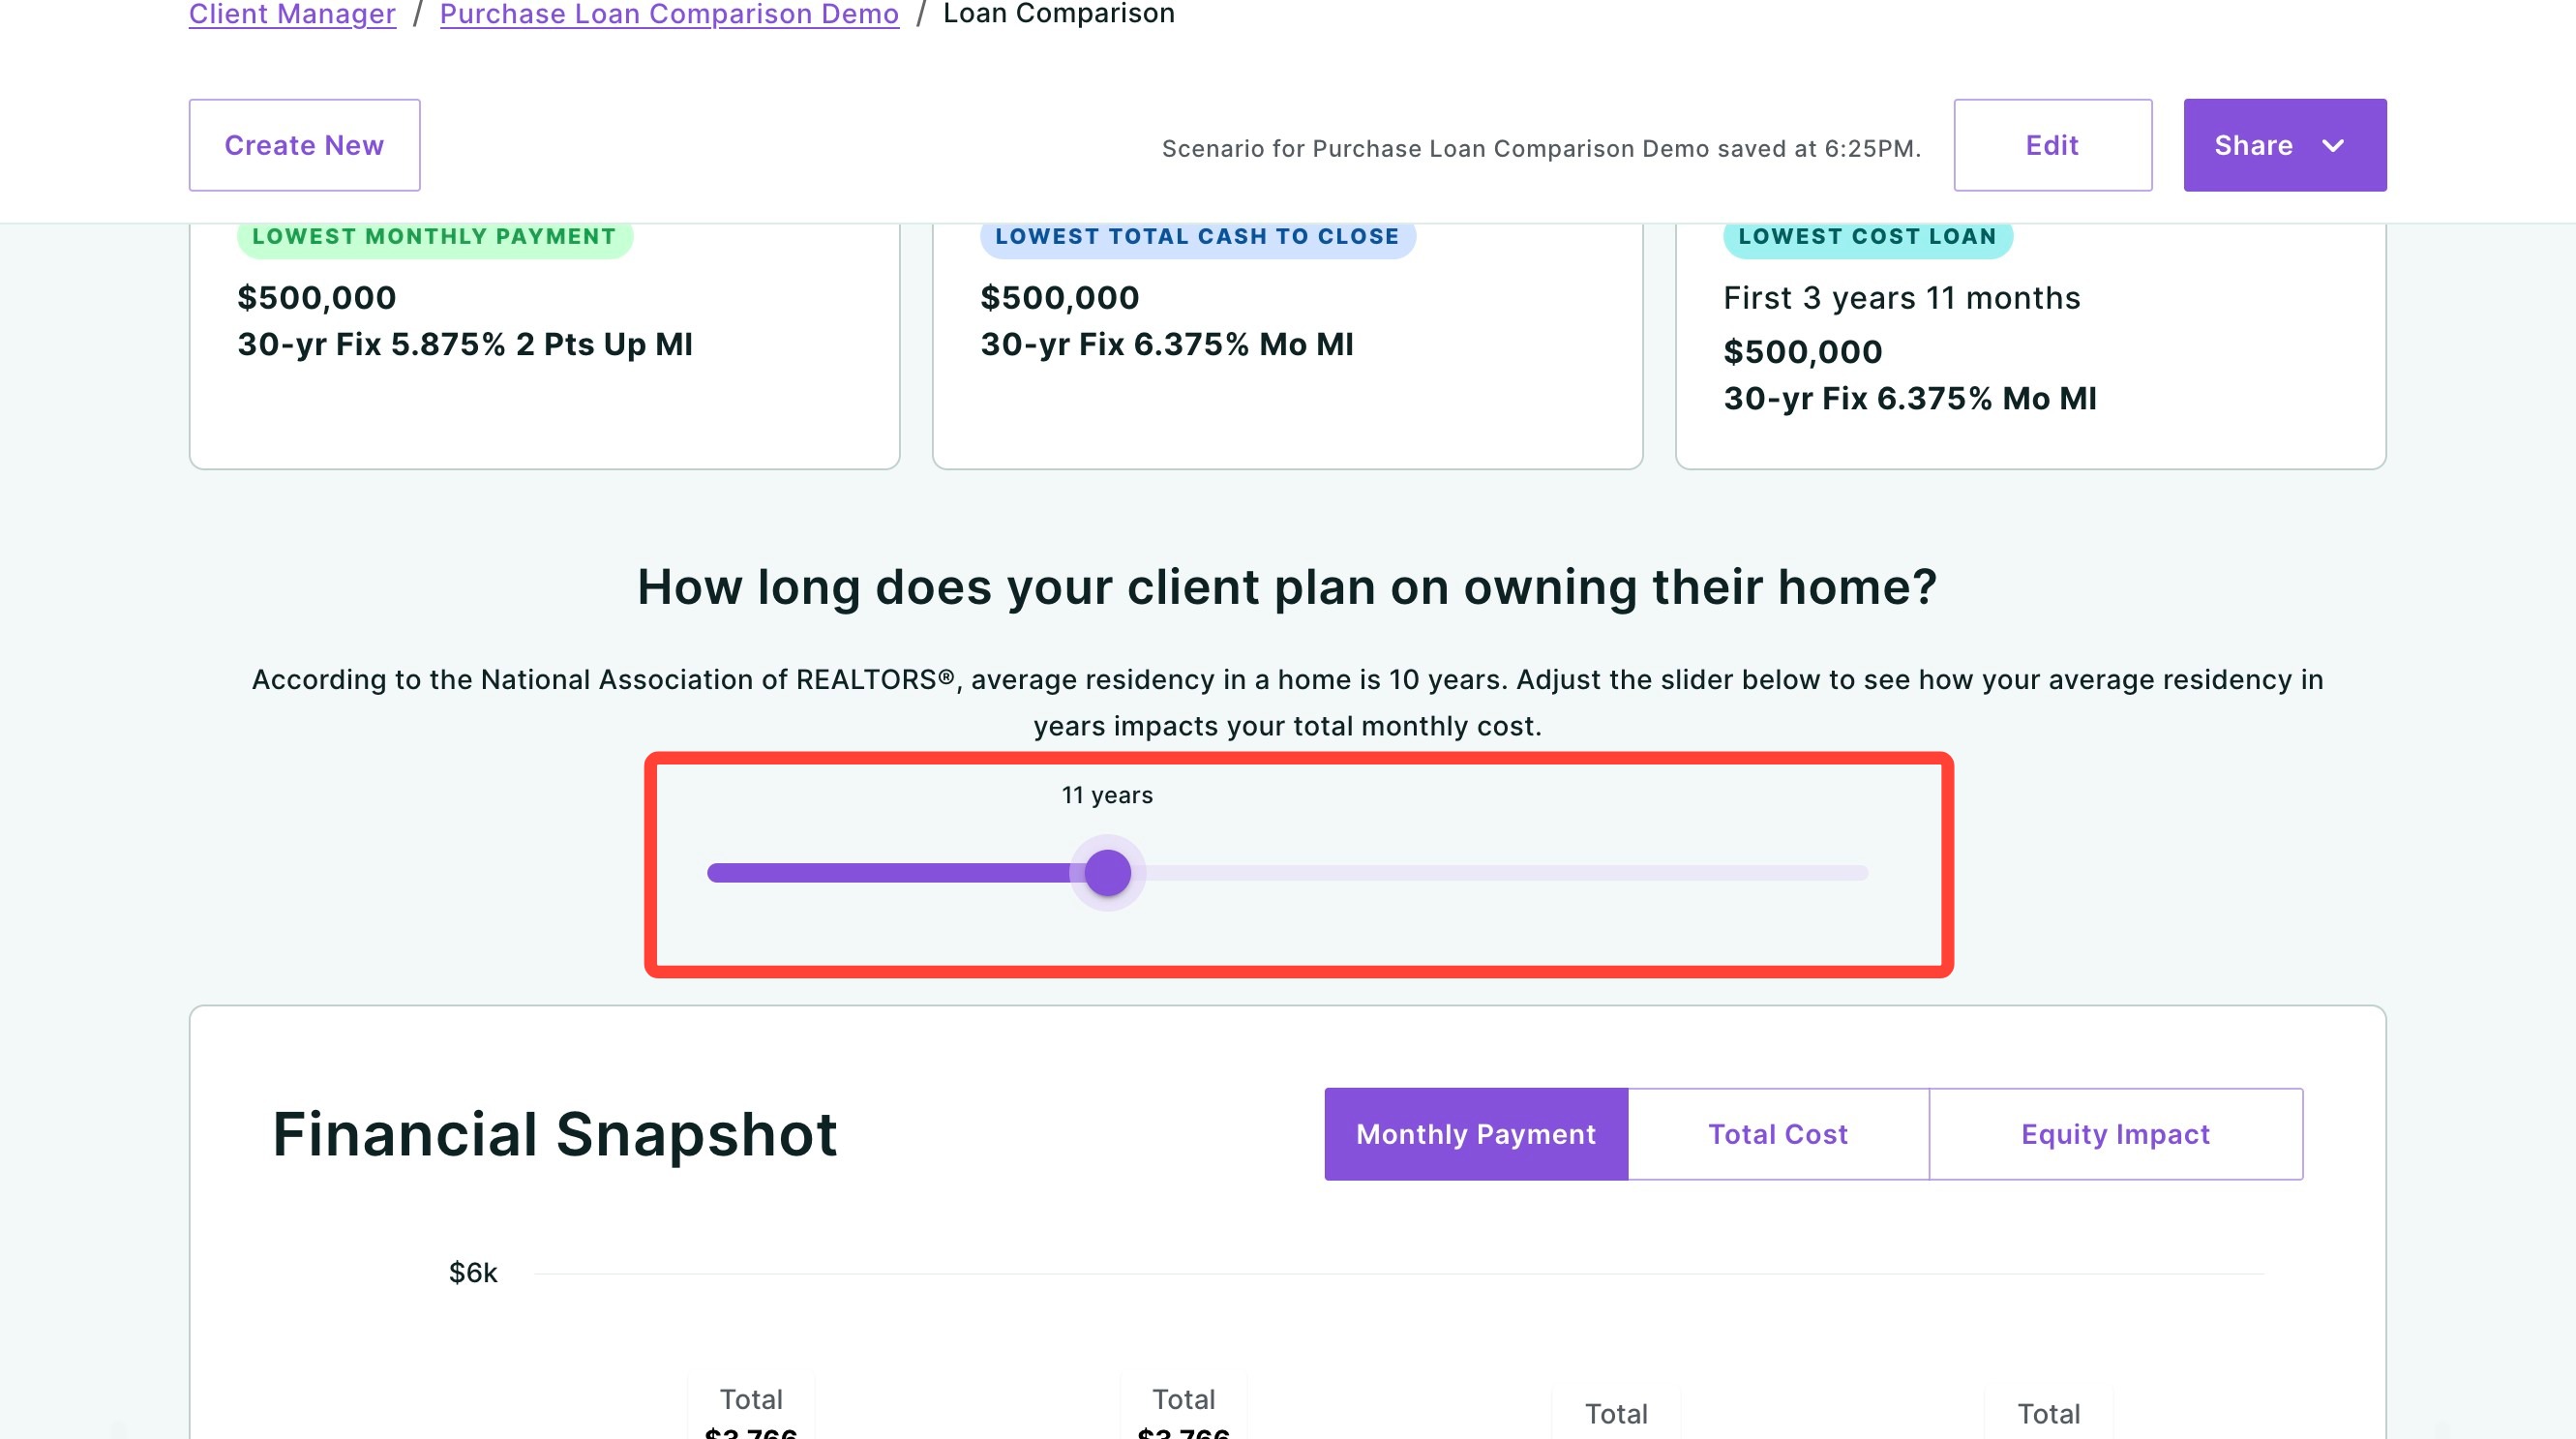
Directly below the header, three cards highlight the top-performing loan in each key category:
- Lowest Monthly Payment Shows which loan option results in the lowest monthly cost for your client.
- Lowest Total Cash to Close Identifies the loan requiring the least amount of money at closing.
- Lowest Cost Loan Reveals which loan will cost the least over the selected residency period, factoring in all costs.
Each card displays the loan amount, product type, rate, and any relevant details (such as points or mortgage insurance type) so you can quickly see which scenario wins in each category. Loans are labeled by their product description rather than numbered options, making it clear exactly which loan is being referenced.
Residency Slider
Below the ranking cards, you will see the question: "How long does your client plan on owning their home?"
Use the slider to adjust the number of years your client plans to stay in the home. The default is based on the National Association of REALTORS® average residency of 10 years. As you move the slider, all of the cost estimates and comparisons throughout the Financial Snapshot will update in real time to reflect the selected time frame.
Financial Snapshot
The Financial Snapshot is organized into three toggleable tabs that let you focus on one aspect of the comparison at a time without navigating away from the page:
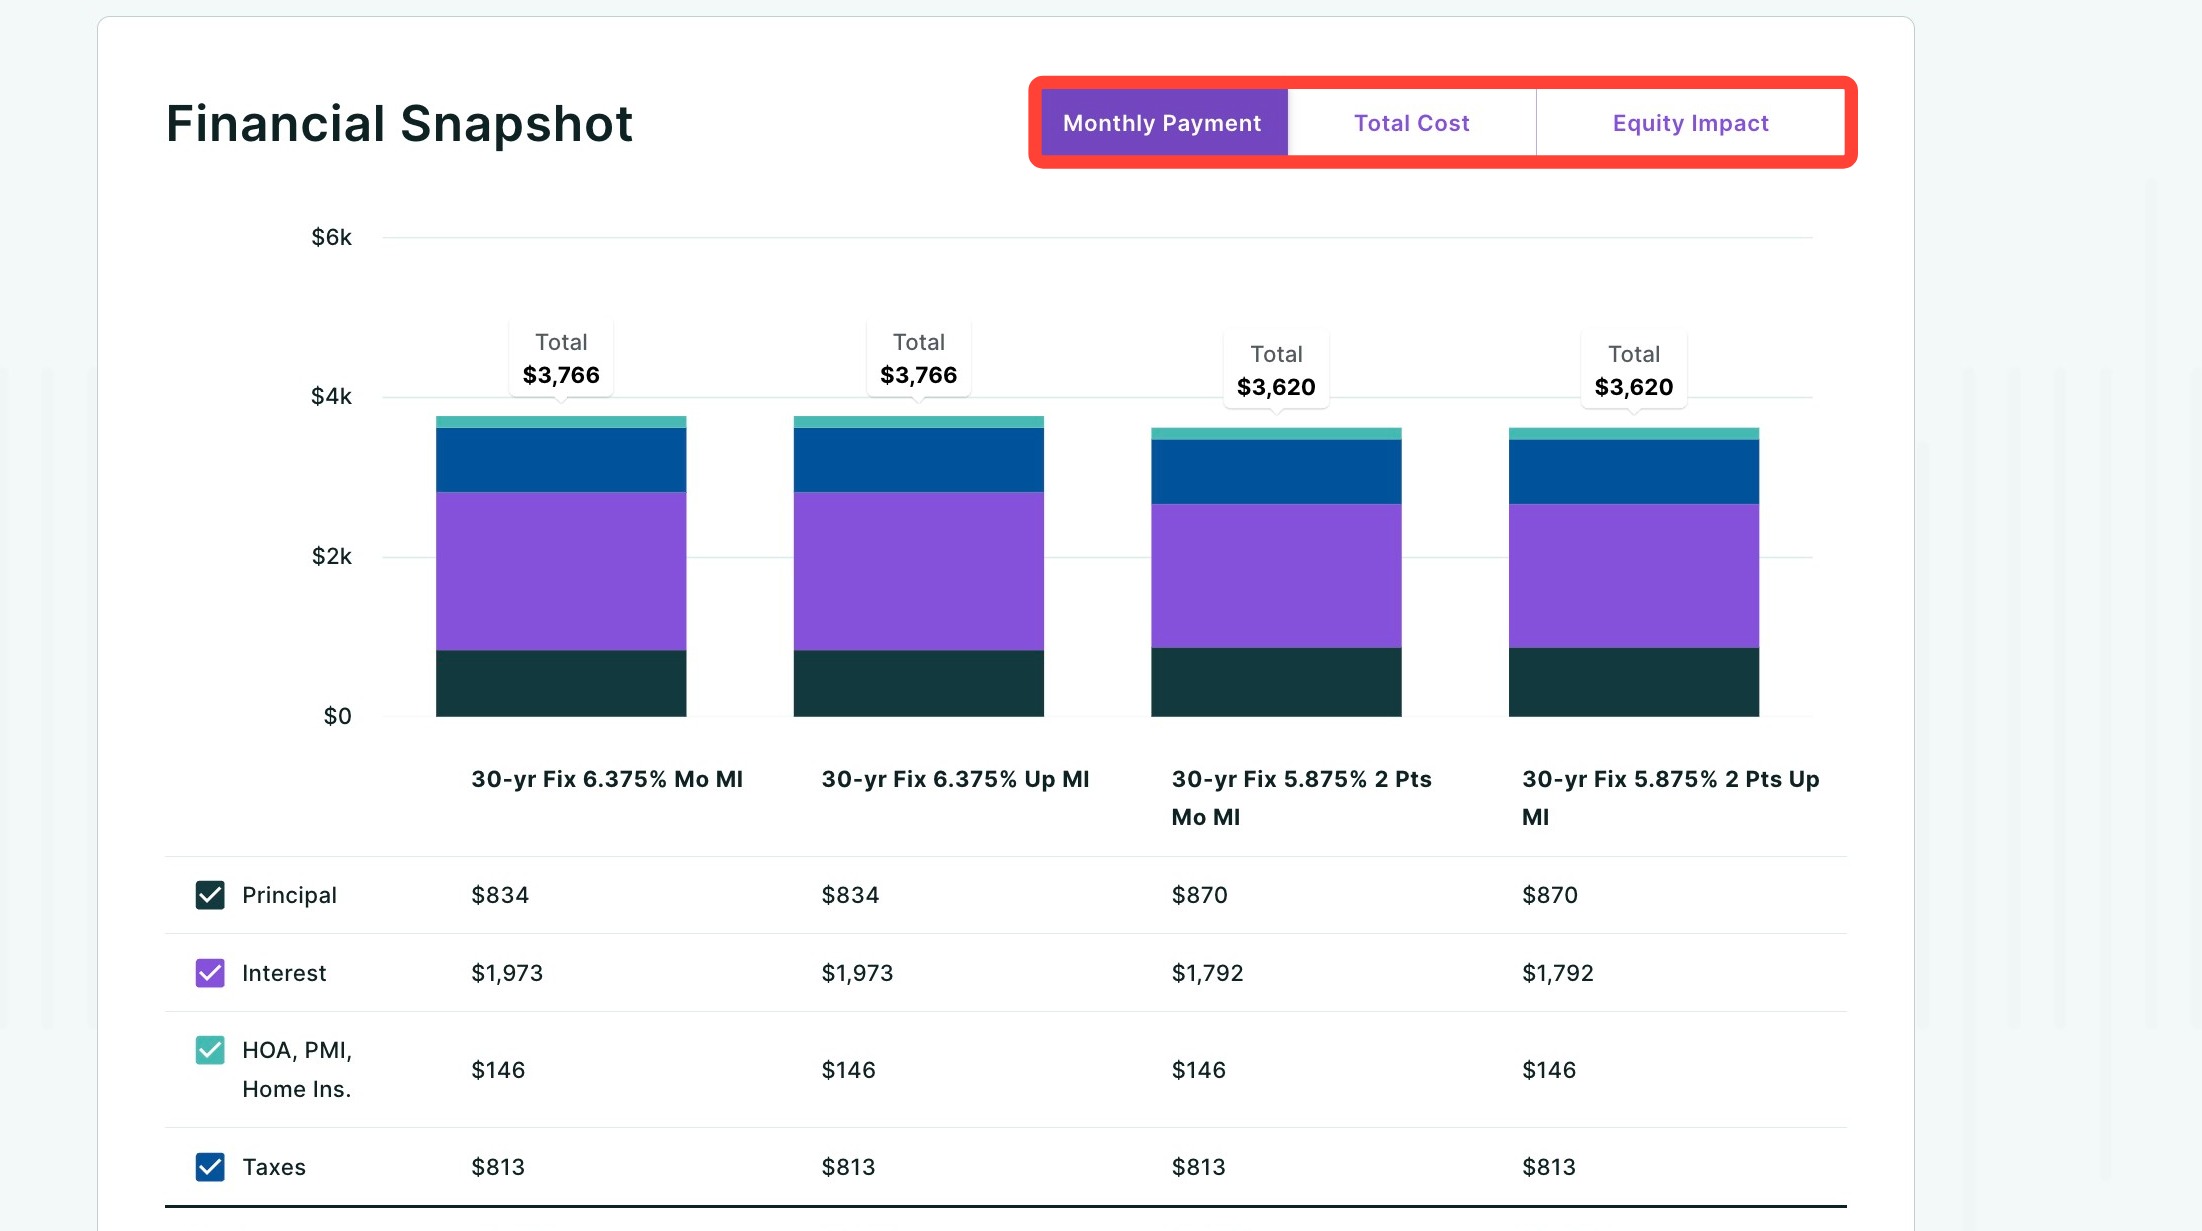
Monthly Payment Tab
This is the default view when the report loads. It displays a stacked bar chart comparing the total monthly payment for each loan option, broken down by:
| Category | Description |
|---|---|
| Principal | The portion of the monthly payment applied to the loan balance. |
| Interest | The monthly interest cost based on the loan's rate. |
| HOA, PMI, Home Ins. | Combined monthly costs for homeowners association fees, private mortgage insurance, and homeowners insurance. |
| Taxes | Estimated monthly property tax amount. |
| Total | The total monthly payment across all categories. |
| Diff. vs. Highest | Shows how much less this loan costs per month compared to the most expensive option. A money bag icon with green text indicates savings. |
Each category row includes a checkbox that you can toggle on or off to show or hide that component in the bar chart, allowing you to focus on the cost areas that matter most to your client.
Total Cost Tab
Click the Total Cost tab to view the cumulative cost of each loan over the selected residency period. This tab features an area chart that plots the net cost in dollars over time (in years), making it easy to see which loan becomes the most affordable as time goes on.
Below the chart, a detailed breakdown compares the following for each loan:
| Category | Description |
|---|---|
| Purchase Price | The property purchase price used for the scenario. |
| Financed MI | Any mortgage insurance that has been financed into the loan. |
| Closing Costs | Total estimated closing costs for the loan. |
| Interest | Total interest paid over the selected residency period. |
| Cost of Points | The upfront cost of any discount points purchased. |
| Mortgage Insurance | Total mortgage insurance paid over the selected period. |
| Credits | Any lender credits applied to the loan. |
| Total | The sum of all costs for the loan over the selected period. |
| Diff. vs. Highest Cost | The savings compared to the most expensive loan option. |
The lowest cost loan option is highlighted in yellow so it stands out at a glance.
Equity Impact Tab
Click the Equity Impact tab to see how your client's home equity is projected to grow over time. This tab contains two sections:
Projected Home Value — Displays the forecasted value of the home over the next 15 years, based on the appreciation calculation you chose when setting up your report (forecast, historical, or custom). The property's address is shown along with the projected value and the total dollar and percentage increase. Key milestones at 5, 10, and 15 years are marked on the chart for easy reference.
Equity Snapshot — A comparison table that breaks down the total home equity your client will have at the selected residency period for each loan option. The breakdown includes:
| Category | Description |
|---|---|
| Purchase Price | The original purchase price of the property. |
| Principal Paid | The total amount of principal paid down over the selected period. |
| Property Appreciation | The estimated increase in the home's value over time based on your chosen appreication calculation. |
| Down Payment | The initial down payment amount. |
| Total Equity | The combined equity from principal payments, appreciation, and down payment. Highlighted in green with a money bag icon. |
| Remaining Loan Balance | The outstanding loan balance at the end of the selected period. |
Detailed Comparison
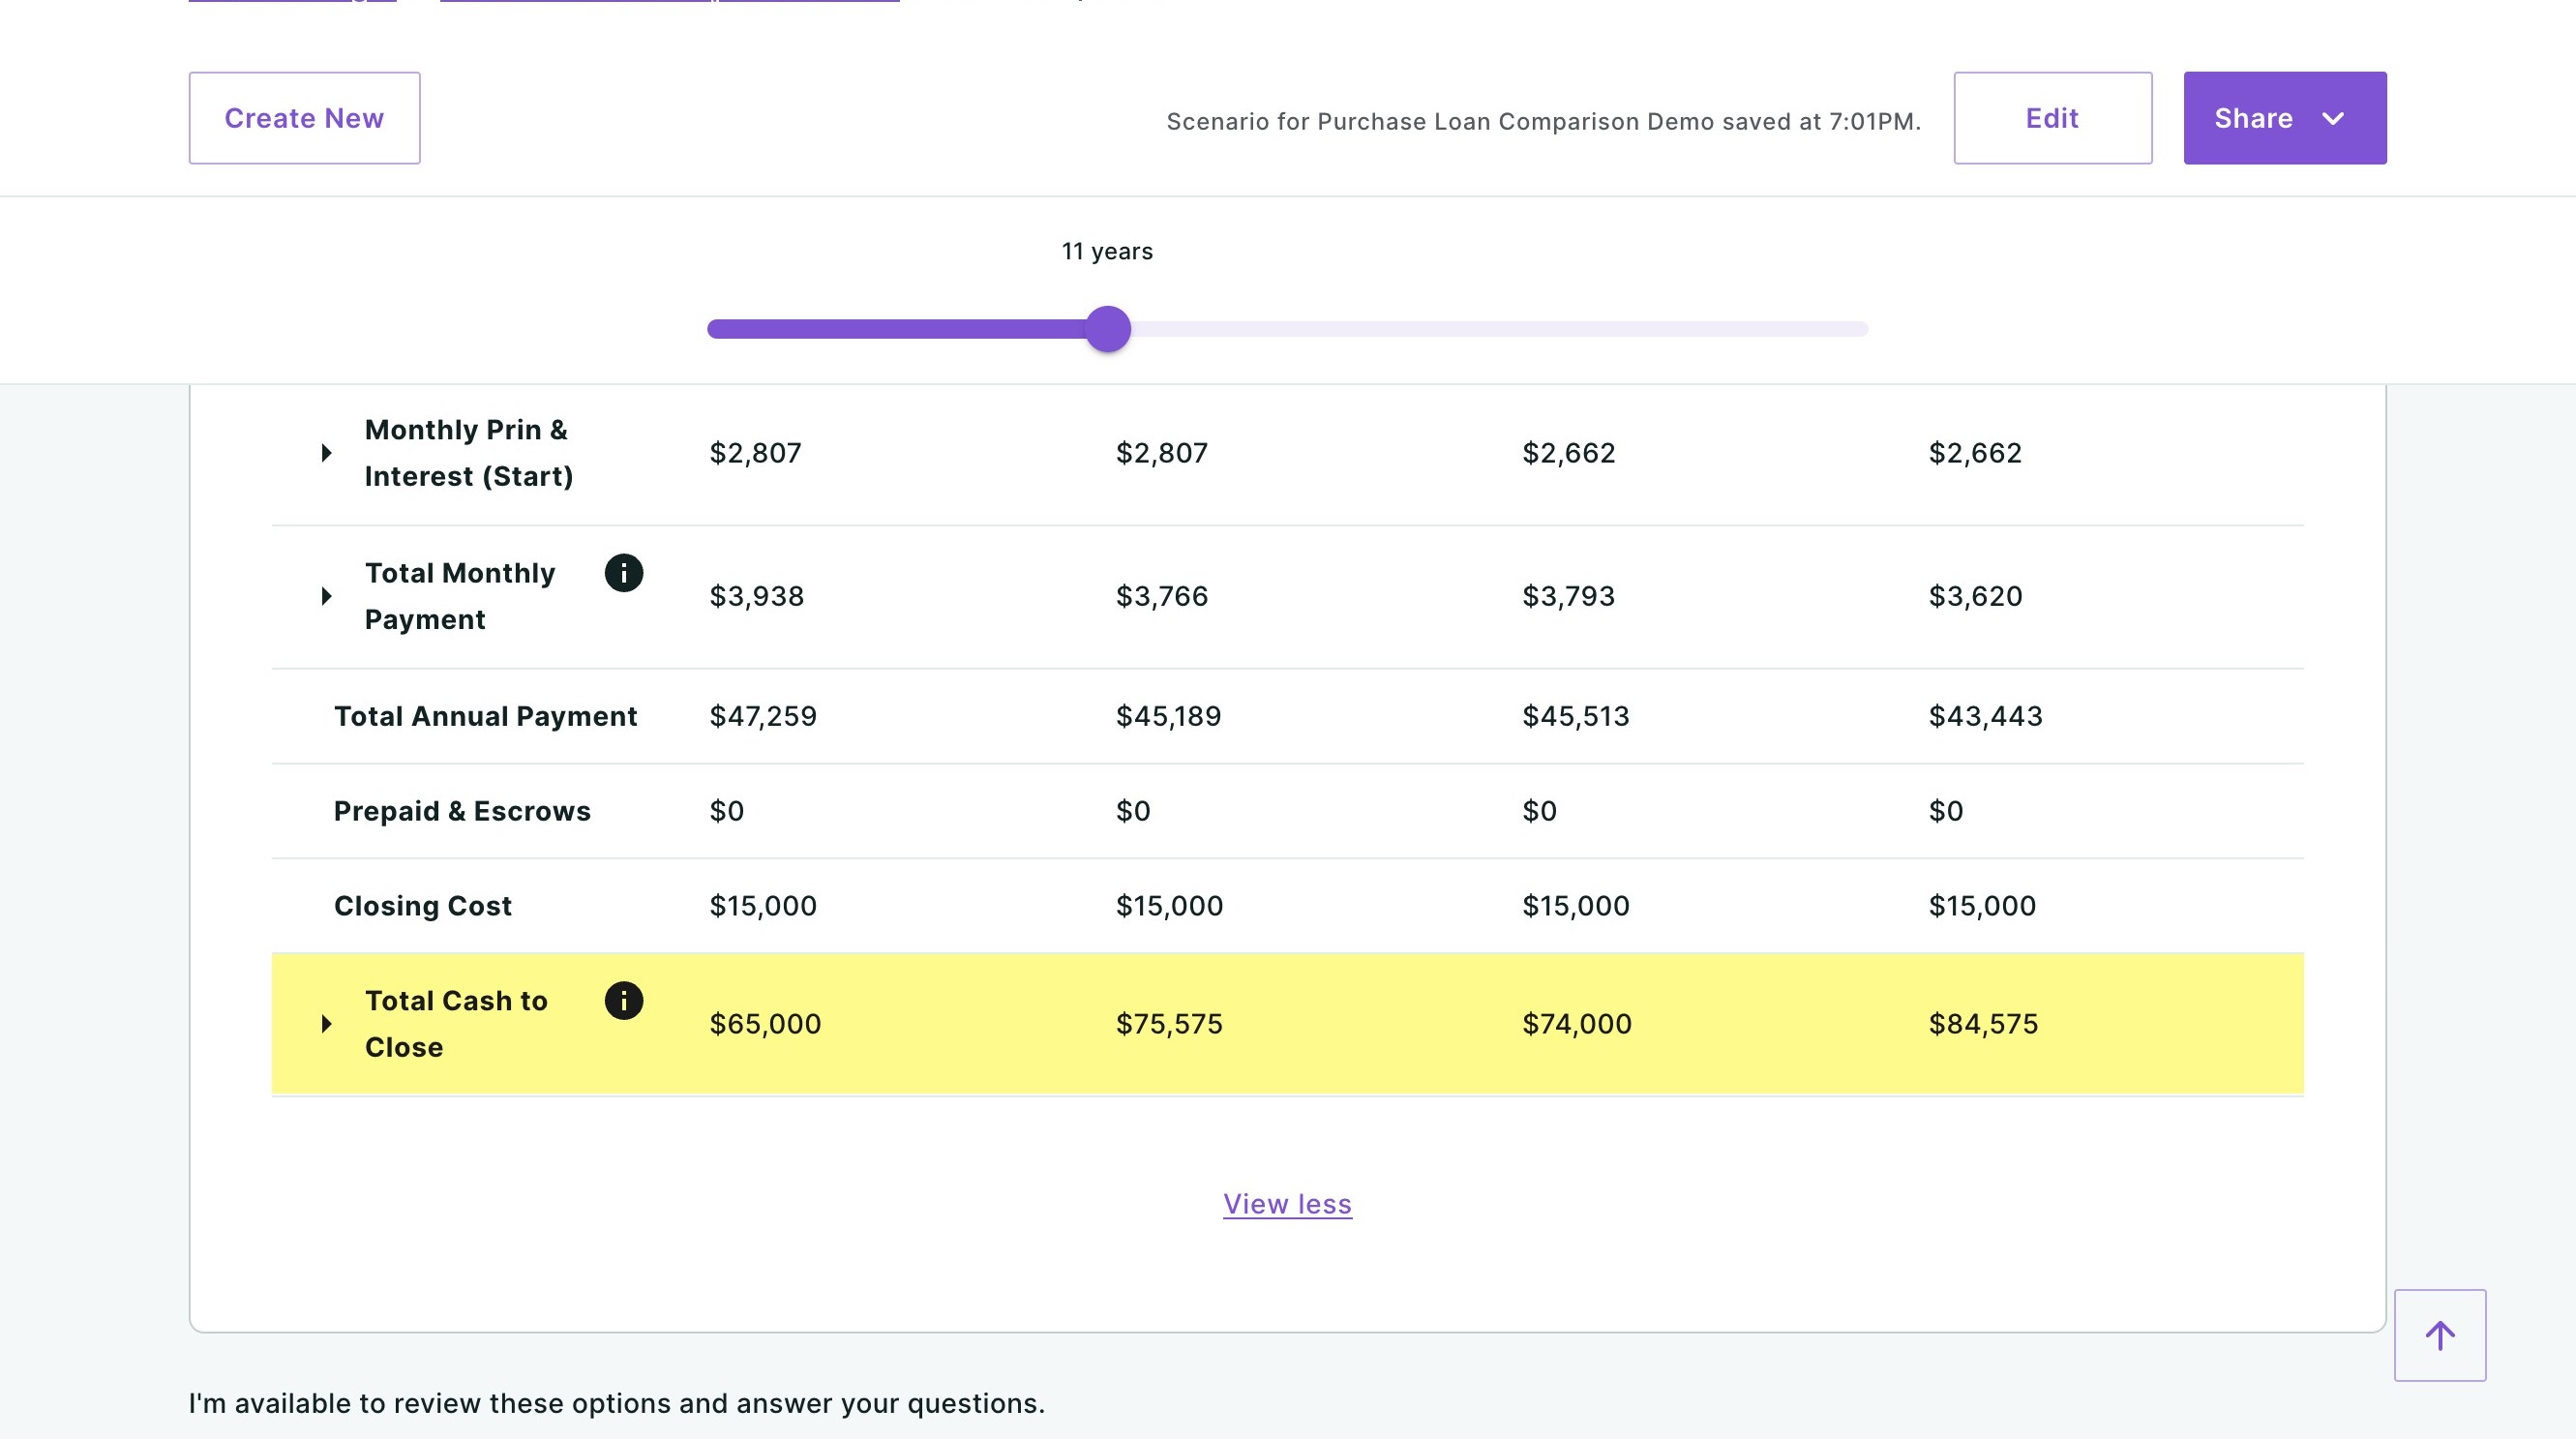
The Detailed Comparison section provides a full side-by-side breakdown of each loan's terms. The header reads "Take an in-depth look at each loan option."
You can click the rows, columns and cells to highlight specific numbers you would like to bring attention to for your clients. For example, in the image below, I have highlighted the Total Cash to Close row:
For each loan, you will see:
| Field | Description |
| Purchase Price | The property purchase price. |
| Loan Amount | The financed amount after down payment. |
| Term | The loan term (e.g., 30 Years). |
| Down Payment | The amount put down on the home. |
| Total Addl. Financing | Any additional financed amounts (e.g., financed mortgage insurance). |
| Rate | The interest rate. Click the info icon for additional details. |
| APR | The annual percentage rate, reflecting the total cost of borrowing. Click the info icon for more. |
| Points | The number of discount points purchased and their dollar cost. |
| Fixed/ARM | Whether the loan is a conventional fixed-rate or an adjustable-rate mortgage. |
| Mortgage Insurance | The monthly mortgage insurance cost, if applicable. |
| Annual Prin & Interest (Year 1) | The total principal and interest paid in the first year of the loan. |
| Monthly Prin & Interest (Start) | The starting monthly principal and interest payment. Click the expand arrow to see a year-by-year breakdown. |
| Total Monthly Payment | The full monthly payment including taxes, insurance, and fees. Click the expand arrow for a detailed breakdown, or the info icon for more. |
| Total Annual Payment | The total amount paid toward the loan each year. |
| Prepaid & Escrows | Any prepaid items or escrow deposits collected at closing. |
| Closing Cost | Estimated closing costs for the loan. |
| Total Cash to Close | The total amount due at closing (down payment + closing costs + prepaids). Click the expand arrow to see itemized costs, or the info icon for more. |
Click "View all" at the bottom to expand the full comparison and see all available data points.
Each loan column also includes two clickable links:
- View Amortization — Opens the full amortization schedule for that loan, showing how principal and interest payments change over the life of the loan.
- Add Reinvestment Strategy — Allows you to model what would happen if your client reinvested their monthly savings (for example, from choosing a lower-payment loan) into another vehicle.
Need Help?
Have questions or want to learn more? Submit a ticket or call us today!
Related to